
DeepScan #3: Nippon Life India AMC
What makes it the most distinct asset management platform in the country?

Hello!
This is the third edition of our DeepScan series: an extension of the research process we follow at Finology 30.
We have already covered the asset management industry, the sector’s long-term opportunity, and the business analysis of HDFC AMC and ICICI AMC. A quick read of those first will help you get more out of this piece.
This week, we are looking at Nippon Life India Asset Management Ltd. I’ve also added two updates from the team at the end. So do check them out.
Nippon Life is India’s largest non-bank-sponsored and foreign-owned asset management company and commands the widest mutual fund investor base in India, with 2.38 crore unique investors on its platform. This is significantly higher than ICICI Prudential AMC’s 1.70 crore and HDFC AMC’s 1.67 crore unique investors. In other words, more than one in three mutual fund investors in India invest with Nippon.
Earlier, Nippon Life India AMC was known as Reliance Nippon Life Asset Management. But in 2019, Reliance Capital exited the business as part of its debt-reduction exercise. That’s when Nippon Life Insurance increased its ownership stake and became the controlling shareholder.
This transition was vital because asset management is ultimately a trust business. -
Investors invest money through AMCs because they believe the institution will act responsibly for years to come.
Distributors also need confidence that the AMC has stable ownership, strong processes and long-term continuity.
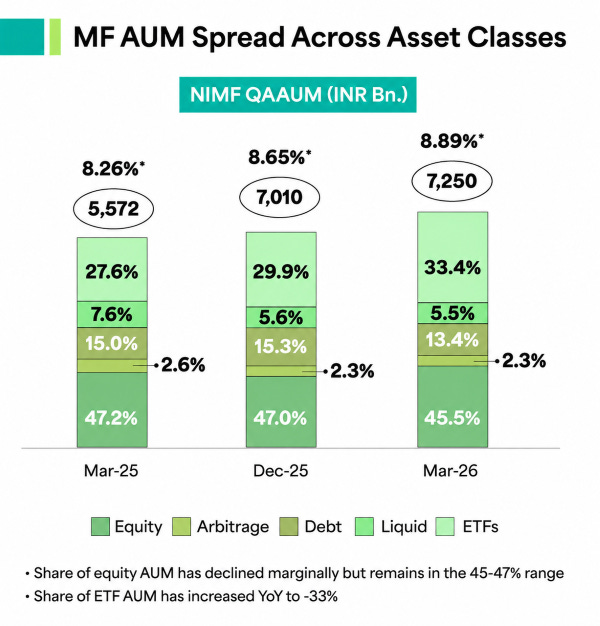
Its market share reached 8.89%, the highest since June 2019
Unlike bank-sponsored AMCs, Nippon did not have a captive banking channel to rely on. It had to build its distribution engine the hard way, through a wide and granular network of independent partners.
The strength of Nippon’s model is diversification.
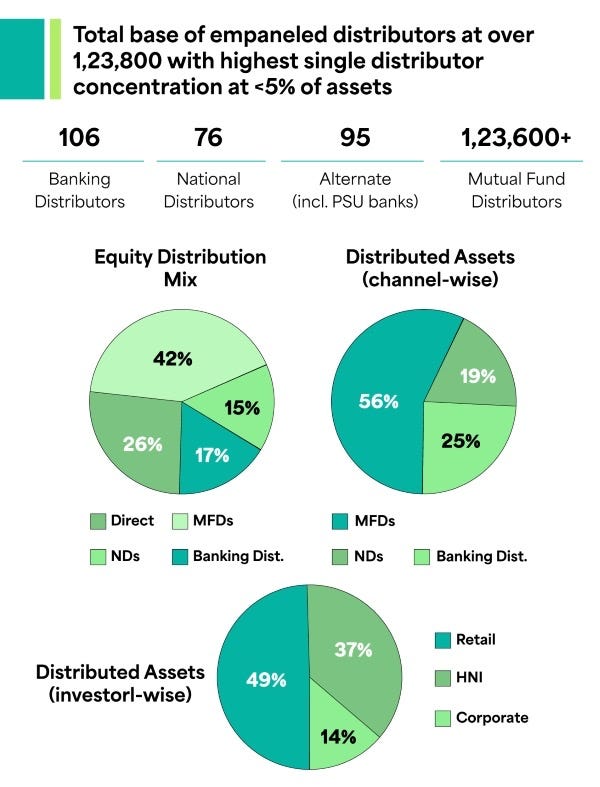
Mutual fund distributors account for 42% of Nippon’s equity distribution, compared with 36.7% for ICICI Prudential AMC and 31.0% for HDFC AMC. The company works with more than 1,23,800 distribution partners, giving it one of the wider on-ground distribution networks in the industry.
Unlike HDFC and ICICI, whose captive parent banks contribute 6.5% and 7.9% to their respective active equity books, Nippon operates a completely de-risked distribution model where absolutely no single distributor accounts for more than 5% of Nippon’s total assets.
This reduces dependence on any one channel or partner and makes the franchise less exposed to the concentration risks that can come with bank-led distribution models.
This distribution strength can also be seen in Nippon’s retail and smaller-city presence. In FY26, retail AAUM contributed 27.4% of Nippon’s total AAUM, which is among the highest in the industry.
Its retail folios crossed 3.60 crore as of March 2026. Nippon also had ₹1.43 lakh crore of AUM from B30 locations, accounting for 20.1% of total assets, which is higher than the industry average of 18.2%.
The other important difference comes from product strategy.
While HDFC AMC and ICICI Prudential AMC have built stronger identities around active mutual funds, Nippon has created a distinct position in the passive and ETF market. This is a lower-fee business, but it works on scale, liquidity and volumes.
Today, passive ETFs account for 33.4% of Nippon’s total mutual fund AUM, amounting to ₹2.42 lakh crore. More importantly, Nippon has become the liquidity leader in this category, commanding nearly 52% of ETF trading volumes across the NSE and BSE. It also controls around 45% of all ETF folios in the industry.
In active mutual funds, investors usually diversify across multiple schemes. But in ETFs, the underlying asset is often the same, whether it is Nifty 50, gold or any other index. That makes the product more commodity-like.
In the ETF business, liquidity is very important. Large institutions, provident funds, and traders usually prefer ETFs because they can buy or sell large quantities easily without moving the price too much.
Nippon’s strong advantage?
Its ETFs have high trading volumes, which means buyers and sellers are easily available. This keeps the difference between buying and selling prices low.
Once an ETF becomes highly liquid, more investors start using it. As more investors come in, liquidity improves further. This creates a strong loop.
What happens if a new AMC launches a cheaper ETF?
Well, large investors may still prefer Nippon because trading in Nippon’s ETF is easier and cheaper in practical terms.
Even globally, the top three or four ETF players in a country typically control 80-90% of the market. That is why Nippon’s leadership in ETFs is important. In a scale-driven business, early leadership becomes difficult to replicate.
For decades, mutual funds were largely built around active fund management. The promise was:
Give money to a skilled fund manager
They’d select better stocks and avoid weak companies
You’d generate returns higher than the benchmark
Sure, the idea still has value, especially in less researched parts of the market. But over time, investors have realised that beating the market consistently is much harder than it looks.
The US is the best example of this.
In 2010, index mutual funds and index ETFs accounted for only 19% of long-term fund assets in the US. By 2025, this share had increased to 52%. In absolute terms, index mutual funds and index ETFs had grown to around $19.1 trillion by the end of 2025. ETF assets alone increased from $992 billion in 2010 to $13.4 trillion in 2025, implying a CAGR of roughly 19%.
This happened for three reasons.
First, costs matter. In the US, the asset-weighted average expense ratio for actively managed equity mutual funds was around 0.64% in 2025. For index equity mutual funds, it was just 0.05%. For index equity ETFs, it was around 0.14%. This gap may look small in one year, but over 10, 15 or 20 years, it becomes meaningful.
Second, the US market became extremely competitive and efficient. Large companies are tracked by thousands of analysts, fund managers, hedge funds, pension funds and institutional investors. Information travels quickly, pricing gaps close fast, and it becomes difficult for an average active manager to consistently beat the index after costs.
The data reflects this. In 2025, around 79% of active large-cap US equity funds underperformed the S&P 500. Does this mean every active fund is bad? No. It simply means the average active fund finds it difficult to beat a low-cost index fund consistently after fees, trading costs and portfolio mistakes.
Third, and this is often underappreciated, a market cap-weighted index is self-updating. When a company performs well, its market value rises, and its weight in the index automatically increases. When a company underperforms, its weight reduces. If it becomes less relevant, it may eventually move out of the index.
This is why passive investing does not require the investor to predict the next winner in advance. If a company becomes large and important enough, the index gradually gives it a higher weight.
The Magnificent Seven are a good example. Apple, Microsoft, Amazon, Alphabet, Meta, Nvidia and Tesla became such large value creators that they eventually became a major part of the S&P 500. By the end of 2024, these seven companies accounted for roughly one-third of the S&P 500’s market cap and contributed more than 40% of the index’s total return in 2025.
India is now moving in the same direction.
However, we are still much earlier in the journey. In March 2020, India’s passive fund categories, including index funds, gold ETFs and other ETFs, had total assets of around ~₹1.63 lakh crore. By March 2026, this had increased to around ~₹13.73 lakh crore. That is more than an 8x increase in six years, implying a CAGR of roughly 43%.
During the same period, the overall mutual fund industry grew from ₹22.26 lakh crore to ₹73.73 lakh crore, implying a CAGR of around 22%.
Active equity funds also grew strongly, from ₹5.79 lakh crore to ₹31.98 lakh crore, implying a CAGR of roughly 33%.
So the point is not that active funds are weak in India. They are not. The point is that passive funds have grown even faster. As a result, passive funds have moved from around 7% of industry AUM in March 2020 to nearly 19% by March 2026.
India will not copy the US exactly.
Active funds may continue to remain important, especially in small-cap and specialised strategies where inefficiencies are higher and good fund managers can still add value.
If you ask me, there are businesses that can outperform over years. But finding those businesses takes time, patience, and a lot more research than most people realise.
That’s the challenge Finology 30 is built to take on. It’s a list of 30 long-term stocks we’ve spent an unreasonable amount of time researching; businesses we believe deserve a place in a portfolio.
Now, the broad direction is clear:
As markets mature, costs matter more.
As benchmarks become more accepted, investors become more comfortable buying the index.
And as more money moves into passive products, scale and liquidity become important competitive advantages.
As of March 2026, Nippon India Mutual Fund managed 112 schemes, of which 103 were open-ended schemes, including 46 active schemes and 57 passive schemes.
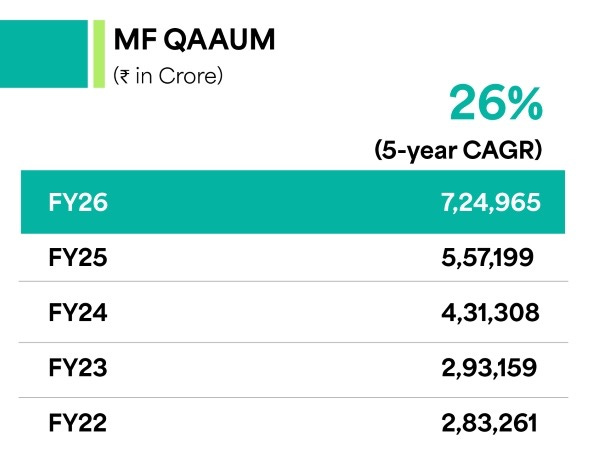
Between FY22 and FY26, Nippon’s mutual fund QAAUM increased from ₹2.83 lakh crore to ₹7.25 lakh crore, translating into a CAGR of around 26%, compared with around 21% CAGR for the overall mutual fund industry AUM during the same period.
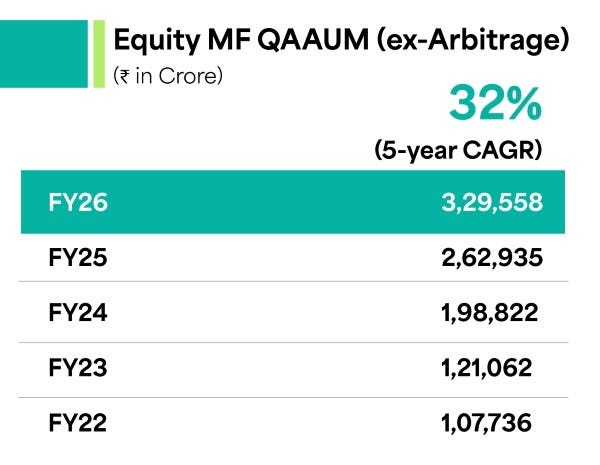
Active equity remains the higher-yielding part of the business. Nippon’s active equity QAAUM, excluding arbitrage, increased from ₹1.08 lakh crore in FY22 to around ₹3.30 lakh crore in FY26, implying a CAGR of around 32%.
Many of its flagship equity schemes have a long track record of 16 to 30 years. This gives confidence to distributors and long-term investors.
In FY26, Nippon’s equity market share also improved by 0.24%. Business is not only growing in AUM but also slowly gaining back market share.
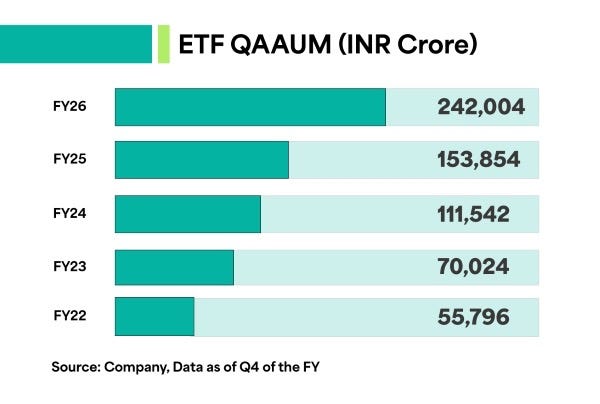
ETFs give Nippon scale. Its ETF QAAUM increased from ₹55,796 crore in FY22 to ₹2.42 lakh crore in FY26, implying a CAGR of around 44%. Nippon’s ETF market share stood at 21.4% in FY26.
Another important part of Nippon’s passive & ETF business?
Gold and silver ETFs. Nippon’s combined gold and silver ETF AUM stood at around ₹84,800 crore as of March 2026. In QAAUM terms, these two products represented around 36% of Nippon’s ETF AUM and 12% of its total mutual fund AUM.
While this improves scale, it also changes the revenue profile.
Nippon’s equity yield was around 0.53%, debt yield was around 0.25%, ETF yield was around 0.25%, and overall yield was around 0.37%.
So ETFs are not as profitable as active equity funds, but they add scale, volumes and investor reach.
HDFC AMC’s blended revenue yield is around 0.45%, while ICICI Prudential AMC’s net operating revenue yield is around 0.48%.
Now, the difference is not difficult to understand.
Nippon earns reasonably well on active equity, but ETFs form a much larger part of its book. This naturally pulls down the blended yield. HDFC and ICICI have a larger share of active equity, hybrid and higher-yielding products, so their unit economics are better.
Nippon’s systematic book has also scaled sharply over the last few years. The monthly systematic book increased from ₹733 crore in FY22 to ₹3,722 crore in FY26, implying a CAGR of around 42%.
As of March 2026, Nippon had 1.08 crore systematic folios and systematic AUM of around ₹1.52 lakh crore. Its SIP market share stood at 9.84% in March 2026, compared with 5.15% in March 2022.
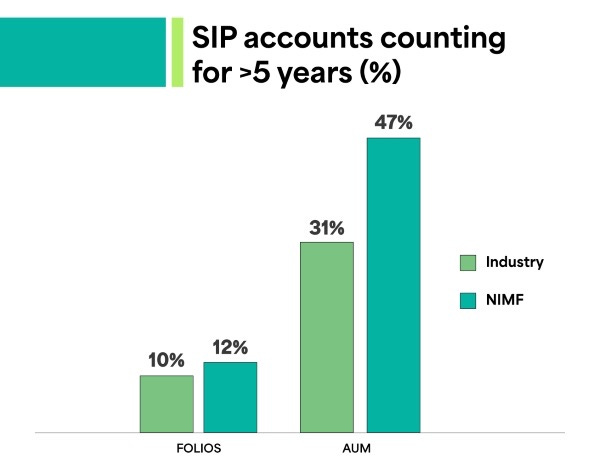
More importantly, it has a more mature SIP book than the industry, meaning a larger share of its SIP AUM comes from investors who have stayed invested for many years. This gives the company a more stable base of flows compared with one-time lump-sum inflows.
The one area where Nippon is clearly behind HDFC AMC and ICICI Prudential AMC is its technology-led distribution engine.
Digital contributed 77% of total new purchase transactions during Q4 FY26. This number is 97% for HDFC and 95.7% for ICICI.
Nippon’s lower digitisation poses a risk, as it can keep costs higher.
The company still depends heavily on its large physical distributor network of over 1,23,000 partners. This helps in retail reach, but it also means part of the business still needs more people, paperwork and operational support.
As a result, Nippon’s operating expense yield is around 0.14% of AUM, higher than HDFC AMC’s ~0.10% and ICICI Prudential AMC’s ~0.11%. This could limit operating leverage if AUM grows sharply, because costs may not reduce as efficiently as more digital-led peers.
Nippon has 4 other businesses apart from MFs.
A managed accounts business is mainly used for institutional clients, where the AMC manages money for large clients outside regular mutual fund schemes.
As of March 2026, Nippon’s managed accounts AUM stood at around ₹94,000 crore, which is ~12% of its total AUM. In FY22, this number was around ₹55,000 crore. So, over FY22 to FY26, managed accounts grew at a CAGR of around 14%.
A large part of this business is linked to managing government-linked accounts such as Postal Life Insurance and Rural Postal Life Insurance.
Its AIF business is smaller, but has better fee potential. AIFs are meant for HNIs, family offices and institutions, and can invest in areas such as public equity, real estate, private credit and venture capital. Nippon’s AIF commitments increased from around ₹4,473 crore in FY22 to ₹9,330 crore in FY26, implying a CAGR of about 20%.
Nippon is also trying to scale this platform through its proposed collaboration with DWS Group, where DWS may acquire up to a 40% stake in Nippon’s AIF subsidiary. This can help Nippon build a stronger alternatives platform and access a wider global investor base.
The offshore business is another small but strategic piece. Through its Singapore subsidiary and Dubai presence, Nippon manages and advises India-focused products for foreign investors. International assets increased from around ₹11,447 crore in FY22 to around ₹15,500 crore in FY26, implying a CAGR of about 8%.
GIFT City is still nascent, with AUM of around USD 38 million(~₹362 crore) as of March 2026. But it gives Nippon a route to bring foreign capital, especially Japanese money, into Indian equity and ETF products over time.
Offshore and GIFT City together account for only around 2% of Nippon’s total AUM, so they are not very relevant to earnings today.
So, mutual funds remain the core business, but managed accounts, AIFs, offshore, and GIFT City give Nippon additional growth options beyond traditional mutual funds.
Coming to how Nippon converts this scale into profits…
Between FY22 and FY26, Nippon’s revenue from operations increased from ₹1,307 crore to ₹2,709 crore, implying a CAGR of around 21%.
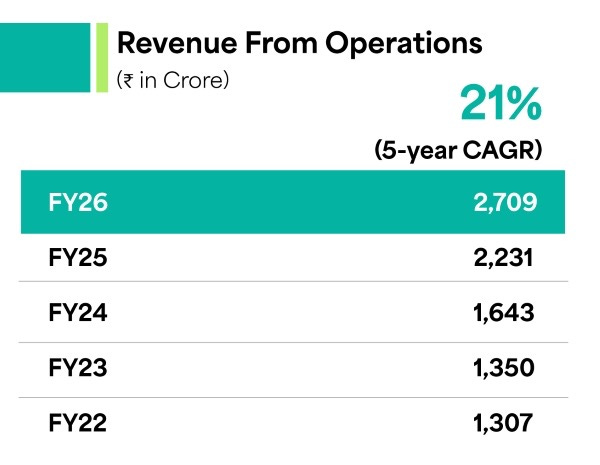
During the same period, core operating profit increased from ₹760 crore to ₹1,748 crore, implying a CAGR of around 23%. PAT increased from ₹744 crore to ₹1,529 crore, implying a CAGR of around 20%.
So, operating profit has grown faster than revenue. This shows operating leverage.
Once an AMC has built its fund management team, compliance setup, distribution network and technology platform, incremental AUM does not require the same increase in costs.
This is visible in the margin profile. Nippon’s core operating profit margin improved from around 58% in FY22 to around 65% in FY26.
In FY26, Nippon declared a dividend of ₹21.50 per share, translating into around 91.5% of standalone earnings. This is typical of a capital-light AMC business. The company does not need to reinvest heavily in fixed assets, so a large part of profits can be returned to shareholders.
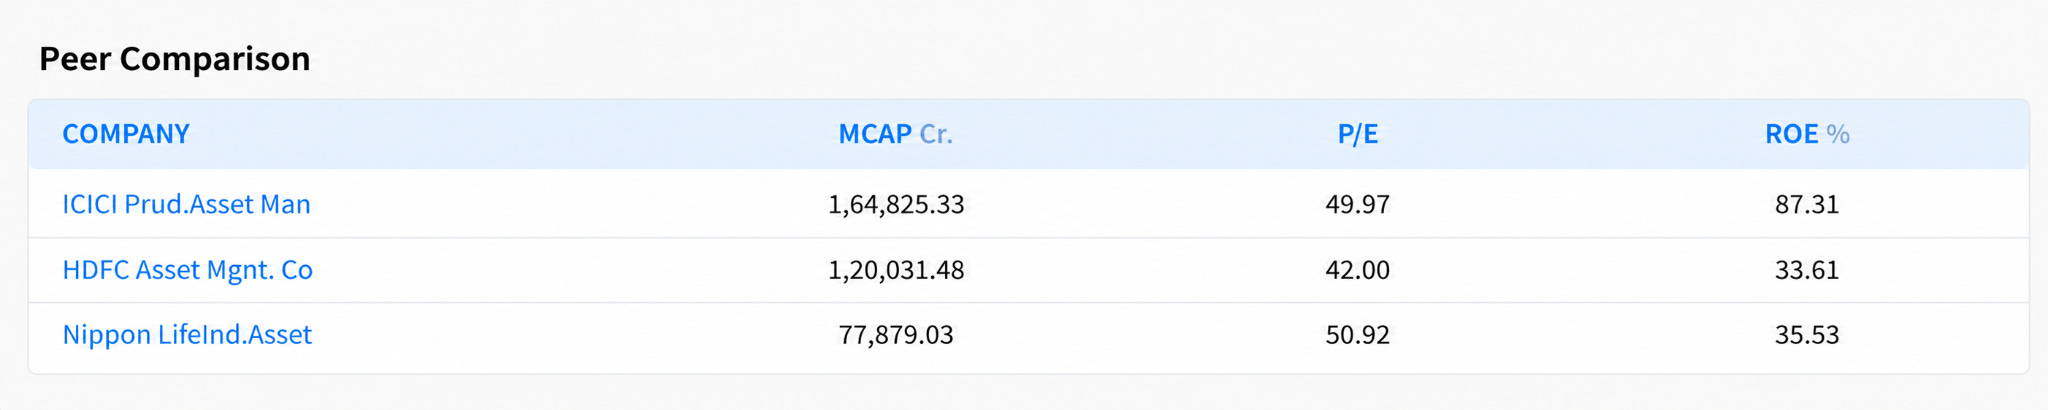
ROE also improved from 23.32% in FY22 to 35.53% in FY26.
In comparison…
ICICI Prudential AMC’s higher ROE is due to its much leaner balance sheet. The reason ICICI’s equity base is lower is simple: it has kept less excess capital sitting on the balance sheet.
In an AMC business, you do not need a large equity base to grow AUM because the business is asset-light. So, when an AMC keeps the balance sheet lean and returns more surplus cash to shareholders over time, ROE naturally looks much higher.
HDFC and Nippon also have strong businesses, but their larger retained capital base makes their ROE look lower than ICICI’s.
Does “different” translate to better than the rest?
The same factors that make Nippon’s model different also create a few risks that investors need to understand.
A large part of Nippon’s recent ETF momentum has come from gold and silver ETFs. These products have helped the company gain AUM, trading volumes and better ETF yields.
As of March 2026, Nippon’s gold and silver ETF AUM stood at around ₹84,800 crore, up 23% QoQ. Together, they formed around 36% of its ETF AUM and 12% of total mutual fund AUM.
This is useful when gold and silver prices are rising, but it can also work the other way. Management has itself said that over the last two to three years, rising gold and silver prices brought many new investors into the category. But when prices corrected recently, volumes also declined.
Sundeep Sikka, MD & CEO of Nippon, also pointed out that commodities move in cycles, and Nippon’s focus is to remain the first choice whenever investors return to the category.
So the risks are clear.
If gold and silver prices cool off, the sharp ETF-led AUM growth and volume growth may moderate.
There’s also the risk of yield pressure. AMC’s revenue depends on how much the company can earn on its AUM. As schemes become larger, telescopic pricing automatically brings down the effective expense ratio. Management has earlier said that blended yields can be reduced by around 0.02-0.03% every year as AUM scales. For Nippon, this is crucial because ETFs already form a large part of its book and earn less than active equity funds.
This is why Nippon needs its active equity, hybrid, SIP and alternate assets businesses to keep growing.
The company has improved its equity market share to 7.16%, and its equity plus hybrid net sales market share is in the high single digits, or double digits excluding NFOs. But active fund flows are competitive.
Industry money is narrowing into categories like flexi cap, and Nippon is still trying to build a stronger share there. If active performance weakens or the company does not gain enough share in large active categories, the business may remain more ETF-heavy and lower-yielding.
Now, valuation is another risk. Nippon is a good franchise, but the stock is no longer cheap. It trades at around 50x trailing earnings, compared with its own historical median of roughly 31x. It is also close to the premium end of the listed AMC pack, with HDFC AMC around 41x and ICICI Prudential AMC around 51x.
A simple reverse DCF shows what the market is expecting. Assuming a 12% cost of equity and 4% terminal growth, the current valuation broadly needs Nippon to grow earnings at around 23% annually for the next 10 years.
That means the stock is already pricing in strong AUM growth, continued ETF leadership, better active equity flows, stable yields and operating leverage.
The risk is that expectations are now high. The company will need to keep executing very well for the valuation to remain justified.
In our view…
Nippon stands apart from HDFC AMC and ICICI Prudential AMC in a slightly different way. HDFC AMC is a cleaner equity-led franchise, while ICICI Prudential AMC has built strength across active funds, hybrid products and alternatives.
Nippon’s edge, however, lies in scale and reach.
It has a wide retail presence, a large distributor network, the biggest unique investor base in the industry and a clear leadership position in ETFs and passive funds. This makes Nippon more of a scale-driven AMC. The biggest trade-off is that its yields are lower because ETFs and passive funds earn much less than active equity schemes.
If you’ve been reading these DeepScans regularly, you’ve probably noticed that we’re less interested in predicting the next hot stock. We don’t tell you to buy the stock.
The purpose is to help you think better about businesses.
But Finology 30 is where we put that thinking into action. 30 businesses that have survived the same questions, tougher scrutiny, and the same research process you’ve just seen in this DeepScan.
Do explore it. I’d love to know what you think.
Finology’s Exclusive Updates
1. Finology 30 Stock Update
This week, we updated our Finology 30 portfolio with a company that has become stronger over the past year.
From improving operating capacity to unlocking new avenues for growth, we believe the business is approaching a meaningful inflection point.
The full research report, along with the company name and Buy It Below price, is available in the Finology 30 dashboard.
2. From Ticker: India's Smart Meter Super-Cycle
While the market focuses on renewable energy, another multi-billion dollar opportunity is unfolding: India’s nationwide smart meter rollout.
As India replaces 250 million legacy meters with smart prepaid ones, the biggest beneficiaries may not be power utilities, but the specialised companies manufacturing the hardware.
How to Spot the Winners on Ticker:
Shrinking Receivables: Smart meters are prepaid. Falling Trade Receivables Days can indicate stronger cash flows and better working capital.
Rising CWIP: An increase in Capital Work in Progress suggests manufacturers are expanding capacity to meet large utility orders.
DuPont Analysis: Check if ROE is supported by healthy margins and efficient asset utilisation.
India’s grid modernisation is creating opportunities beyond traditional power stocks. Use Ticker to identify the specialised businesses powering this transition before the market catches on.
That’s a Wrap for Today!
We’re always looking for interesting businesses and industries to explore.
If you enjoyed this DeepScan, we’d love to hear from you. And if there’s a company, industry, or business model you’d like us to break down next, simply reply to this email or drop a comment.
See you in the next edition!
Pranjal Kamra
Research: Jayesh Mohta
Editorial: Mehvish Qureshi
Disclaimer
The information and analysis provided herein are for educational and informational purposes only and do not constitute investment advice, a research recommendation, or an offer, solicitation, or recommendation to buy, sell, or hold any security. Investors should exercise their own judgment, conduct independent due diligence, and consult professional advisers before making investment decisions. Finology Ventures Private Limited, its affiliates, directors, employees, and research analysts shall not be liable for any loss or damage arising from the use of or reliance on this information.
SEBI Registered Research Analyst Details:
Registered Name : Finology Ventures Private Limited (RA Division)
Registration No : INH000024277
BSE Enlistment No. : 6877
Validity : Dec 16, 2025 - Dec 15, 2030