
DeepScan #1: HDFC AMC
What happens when a growing industry meets an efficient operating model?

Hello,
Welcome to the first edition of Finology DeepScan.
Here, we choose one company each week and look beyond the headlines, how the business works, where its economics come from, and what could shape its future.
Most importantly, we do it with brutal honesty.
This week, we’re looking at HDFC AMC, one of India’s largest asset management companies and a business at the heart of India’s growing mutual fund industry.
For decades, Indian wealth was concentrated in fixed deposits, gold and real estate. Today, an increasing share of household savings is being allocated to professionally managed financial assets.
This migration is creating one of the largest structural opportunities in India’s financial sector.
For investors, it’s financialisation
For AMCs, it’s scale
India’s mutual fund industry has recorded positive net inflows for 14 consecutive years and now manages assets worth nearly ₹81.5 lakh crore.
Monthly SIP contributions have crossed ₹30,000 crore, yet mutual fund AUM is still only 19.9% of India’s GDP, compared with the global average of around 64% and 124% in the US.
This wide gap shows that India’s mutual fund industry is still at a relatively early stage of development.
HDFC AMC: At the Centre of This Transition
More than 27% of the country’s mutual fund investors have invested with HDFC Mutual Fund. What makes the business more interesting is the economics behind this scale.
HDFC AMC operates at a cost of just ~0.10% of AUM, which means it spends just about ₹10 for every ₹10,000 it manages. This is despite expanding its branch network over the last few years and continuing to invest in digital capabilities.
And since costs remain so low, a large share of its revenue flows to profits, helping the company generate a strong 33% return on equity and distribute nearly 81% of its profits as dividends.
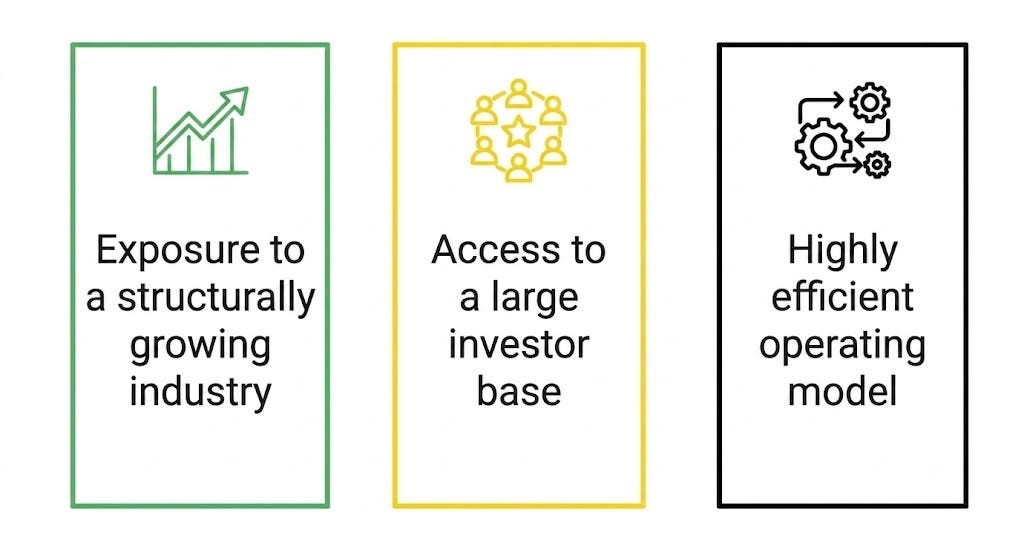
The company, therefore, combines three unusual features:
India’s Mutual Fund Industry: A ₹68 Lakh Crore Wealth Migration
India’s mutual fund AUM has grown from ₹13.82 lakh crore in May 2016 to ₹81.5 lakh crore in May 2026, a CAGR of around 19%.
This growth came from two things: money invested by investors and movement in market prices.
In FY26, mutual funds received ₹157.5 lakh crore of gross inflows, meaning the total money invested in schemes during the year. However, investors also redeemed ₹150.1 lakh crore. So, the net inflow, which is the money left after withdrawals, was only ₹7.4 lakh crore. This is the actual money that stayed in the market.
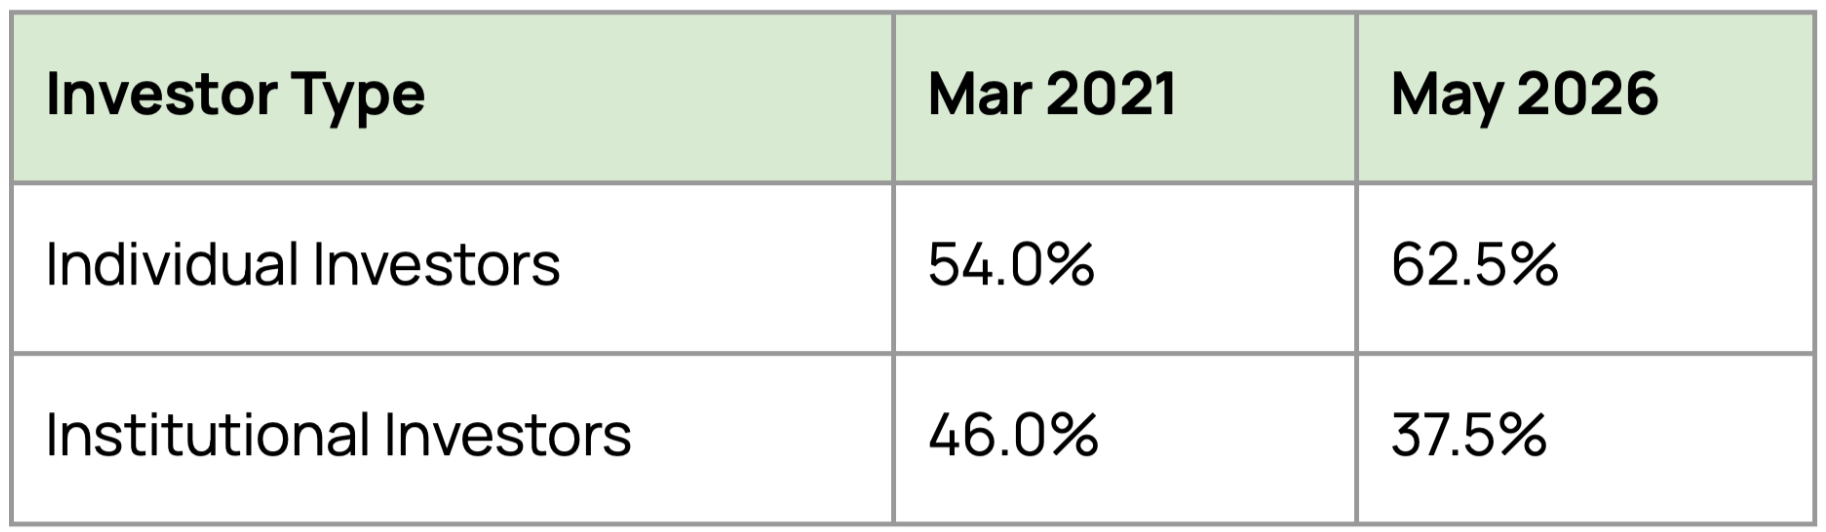
The investor mix is also gradually shifting from institutions towards individuals.
Individuals now own 90.6% of equity-oriented assets and 78.6% of hybrid assets, whereas institutions still control 78.9% of debt-fund assets.
This shift has made the industry more retail- and equity-oriented, creating a relatively stickier and higher-fee asset base for AMCs. At the same time, it also increases the industry’s exposure to equity-market movements.
India vs Mature Markets
The US:
At the end of 2025, the US accounted for $44.8 trillion of the world’s $88 trillion in regulated open-end fund assets, meaning funds where investors can enter or exit anytime, and 56.4% of American households owned investment funds.
A large part of this participation is supported by employer-sponsored retirement plans, like 401(k) and individual retirement accounts, with $14.5 trillion invested in mutual funds through defined-contribution plans and IRAs.

India:
We don’t have a comparable retirement-led distribution engine yet.
Our growth is being driven more directly by SIPs, banks, distributors, fintech platforms, and investors voluntarily shifting savings from deposits, insurance, gold and real estate into market-linked products.
The quarterly average AUM of Indian MFs is expected to grow at around 16-18% annually between FY25 and FY30, potentially reaching ₹147-155 lakh crore.
The Consequence of Low Penetration:
The companies most likely to capture the economic value of this expansion are those that can:
attract recurring retail flows,
maintain fund performance,
build strong distribution,
retain a high share of active equity assets, and
control costs as they scale.
HDFC AMC is worth studying within this framework because it combines a large investor base, an equity-heavy asset mix, an established distribution network and one of the industry’s lowest operating cost structures.
Distribution Still Decides Who Captures the Opportunity
If you thought digital platforms have made investing easier and have removed the role of distributors, you’re wrong.
As of May 2026, 55% of industry AUM came through distributor-led channels.
Even in newer SIP money, the dependence remains visible: As of March 2026, only around 31% of SIP AUM with less than one year of tenure was in direct plans, while nearly 69% was still in regular plans, which are distributor-led.
Also, ~71% of equity-oriented AUM came through distributors.
For an AMC, relationships with banks, national distributors, independent mutual fund distributors and digital platforms remain a major competitive advantage, particularly in equity and hybrid products where investors often need guidance.
Competition is Rising, But Scale Still Matters
The number of SEBI-registered mutual funds reached 59 by June 2026, as new bank-backed, fintech-led and independent asset managers entered the industry.
Yet the market remains concentrated. The top 10 AMCs controlled 76.4% of the industry’s quarterly average AUM in the first half of FY26, although this was lower than 82.7% in March 2021.
This gradual decline shows that new players can gain share, but the continued dominance of established AMCs highlights the importance of scale, investment track record, distribution and brand credibility.
New AMCs are entering the market with differentiated products, but most are still in investment mode. In FY25, among major recent entrants, only NJ AMC was profitable, while names like Zerodha, Navi, Groww, Samco, WhiteOak, Trust and Bajaj Finserv AMC were still loss-making.
Building scale, investment track record, distribution and brand credibility takes time.
The HDFC Brand History
HDFC AMC was incorporated in December 1999 and received SEBI approval in July 2000 to act as the asset management company for HDFC Mutual Fund.
The timing was important. India’s mutual fund industry was still small, investor trust in market-linked products was limited, and distribution was largely physical. In such an environment, the HDFC brand gave the AMC an early advantage.
The larger HDFC group already carried strong trust in financial services, especially among savers looking for safety, credibility and long-term wealth creation.
HDFC AMC was initially backed by HDFC Ltd. and Standard Life Investments. The partnership gave the company a combination of local financial-services trust and global asset-management experience.
Over time, Standard Life gradually exited the business. After the merger of HDFC Ltd. with HDFC Bank, HDFC Bank became the promoter shareholder of HDFC AMC.
Today, HDFC Bank holds 52.37% of the company, making HDFC AMC part of one of India’s largest financial-services ecosystems.
However, the AMC’s business model is not dependent only on its parent bank. As discussed later, HDFC Bank contributes only a small share of the company’s total and equity AUM, while the broader distribution network of MFDs, national distributors, banks and direct channels drives most of the business.
How an AMC Actually Makes Money
An asset management company invests money on behalf of investors and earns a management fee calculated as a small percentage of the assets under management.
At first glance, this looks like a simple volume-driven business where higher AUM leads to higher revenue. In reality, not every rupee of AUM is equally valuable.
Equity funds earn substantially higher fees than debt, liquid and passive funds, while the cost of managing additional assets rises much more slowly than the AUM itself. This difference between asset growth, fee yields and operating costs forms the core of HDFC AMC’s business economics.
Large AMCs currently earn approximately:
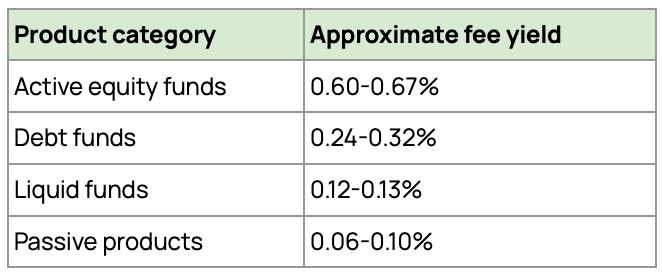
This means the same amount of active equity AUM can generate around 2-3x the revenue of debt AUM, 5-6x the revenue of liquid AUM and 7-10x the revenue of passive AUM.
This difference in fee yields makes HDFC AMC’s asset mix more important than its headline AUM. The company’s closing of ₹8.44 lakh crore of assets cannot be viewed as one uniform pool of money. The earnings potential of this asset base depends on how much is invested in active equity, debt, liquid and passive products, who owns these assets and how long the money remains invested.
This asset mix is central to HDFC AMC’s profitability.
Equity funds require deeper research, portfolio construction and ongoing fund management, which allows AMCs to earn much higher revenue yields of around 0.56-0.59% of AUM.
Passive and liquid funds, by comparison, are more standardised and typically generate only about 0.12-0.13%. Actively managed funds have a higher yield of around 0.60-0.61%.
The Investor Base Makes the Franchise Stickier
Institutional investors such as companies and treasury departments usually invest large amounts, particularly in debt and liquid funds. However, this capital is:
highly price-sensitive,
earns lower management fees, and
can move quickly in response to small differences in yields or short-term liquidity requirements.
Individual investors invest in smaller amounts, but their money is generally more diversified across equity and hybrid schemes, remains invested for longer periods and earns higher fee yields for the AMC.
HDFC AMC has a favourable position on this front. Individual investors contributed 68.2% of its monthly average AUM in March 2026, compared with around 60% for the overall industry.
This retail-heavy investor mix supports both higher revenue yields and greater stability, particularly because individuals account for a large share of the company’s equity-oriented assets.
Individual investors have consistently contributed around 70% of HDFC AMC’s AUM over the last four years, highlighting the company’s strong retail-oriented asset base.
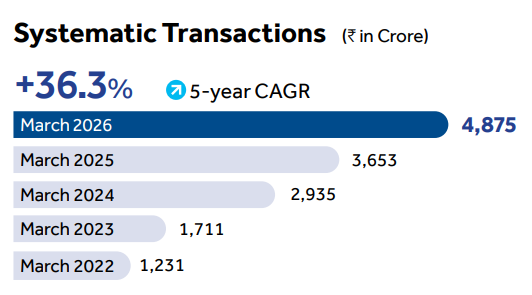
The most important feature of HDFC AMC’s retail base is its recurring nature. Monthly SIP and STP flows rose 33% YoY to ₹4,875 crore in March 2026.
HDFC AMC’s systematic flows have grown faster than the overall industry. Over the last five years, its systematic transactions have increased at a 36.3% CAGR. In comparison, India’s monthly SIP contribution has grown at around 28% CAGR over the same period, rising from ₹9,182 crore in March 2021 to a record ₹32,087 crore in March 2026.
These recurring flows provide a steady source of fresh capital and help cushion the impact of market volatility and institutional redemptions.
Distribution: Wide, Balanced and Increasingly Digital
HDFC AMC has built a wide distribution network of more than 1.09 lakh empanelled partners and 280 offices, giving it access to investors across around 98% of India’s PIN codes.
Of these offices, 196 are located in B30 cities, which accounted for 19.2% of the company’s average monthly AUM in March 2026.
This network has evolved from a largely physical model into a scalable phygital system. The share of transactions processed digitally increased from 69% in FY20 to 81% in FY23 and 97% in FY26.
As a result, HDFC AMC now processes more than 1.65 crore SIP and STP transactions every month without a proportionate increase in branches, employees or servicing costs.
Its distribution is also diversified.
Contribution to Total AUM (March 2026):
Direct channels: 44.6%
Independent mutual fund distributors (MFDs): 23.7%
National distributors: 22.1%
Banks: 9.7% (including 5.2% from HDFC Bank)
At first glance, direct channels appear dominant. However, this is partly because corporate and institutional investors typically invest directly in lower-fee debt and liquid funds.
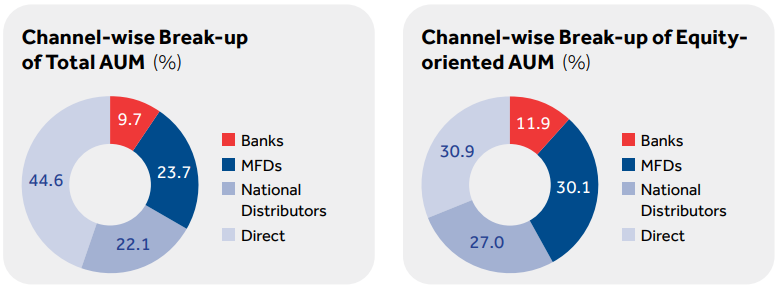
The picture changes when we focus on equity-oriented assets, which are far more important for profitability. Here, direct channels, MFDs and national distributors contribute almost equally, creating a much more balanced sourcing mix.
This balance reduces dependence on any single channel. Even HDFC Bank, despite being the promoter, contributes only 5.2% of total AUM and 6.5% of equity-oriented AUM.
Fund Performance: Does the Product Justify the Fee?
Distribution brings investors into a mutual fund, but performance determines whether they stay.
Active funds charge higher fees than passive products because they aim to outperform their benchmarks. Consistent underperformance would therefore weaken investor retention, reduce fresh inflows and put pressure on fee yields.
HDFC AMC’s longer-term performance has been strong. As of March 2026:
83% of equity-oriented AUM had outperformed its benchmark over three years.
Nearly 99% had outperformed over five years.
Over longer periods, a large part of HDFC AMC’s equity portfolio has remained in the top two category quartiles, with several schemes carrying four- and five-star ratings.
The company has also managed fund-manager transitions without materially disrupting performance. Its mutual fund investment team comprises 37 professionals. This depth reduces dependence on a single star manager and suggests that investment decisions are supported by an institutional process rather than individual judgment alone.
HDFC AMC’s active equity market share has declined from around 20% in the early part of the last decade to nearly 13% today, reflecting rapid industry growth and rising competition. This is a sign of worry and an aspect that should be tracked closely.
How HDFC AMC Converts Scale Into Cash
The economics of an asset management company can be understood through three variables:
The amount of money managed
The fee earned on those assets
The cost incurred to manage them
Between March 2022 and March 2026, HDFC AMC’s closing mutual fund AUM increased from ₹4.07 lakh crore to ₹8.44 lakh crore, representing a CAGR of around 20%.
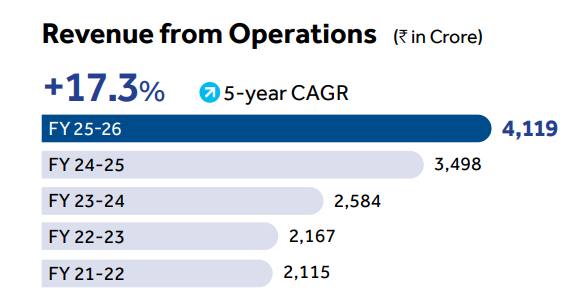
Over the same period, revenue from operations increased from ₹2,115 crore in FY22 to ₹4,119 crore in FY26, a CAGR of 17.3%.
Revenue broadly kept pace with AUM growth despite the telescopic fee structure prescribed by SEBI, under which the expense ratio generally declines as a scheme becomes larger.
Its active equity assets expanded at a CAGR of approximately 25.8% during this period, faster than the overall asset base.
This shift towards higher-fee equity assets helped HDFC AMC maintain a blended operating revenue yield of around 0.45%-0.46% despite regulatory fee compression.
In simple terms, every ₹10,000 of average assets currently generates approximately ₹45-46 of annual operating revenue for the company. Despite this increase in scale, operating expenses remain at only about 0.10- 0.11% of average AUM. This improvement has been supported by digitisation.
After deducting operating costs from the blended revenue yield of 0.45-0.46%, HDFC AMC retains a core operating margin of approximately 0.35-0.36%. Core operating profit increased from ₹1,537 crore in FY22 to ₹3,211 crore in FY26, representing a CAGR of around 18.1%.
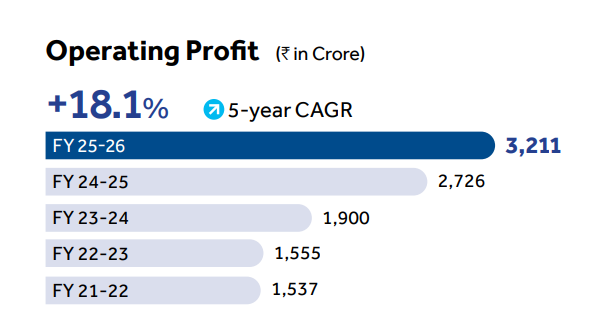
This was faster than the growth in operating revenue, showing that a larger proportion of incremental revenue was converted into profit.
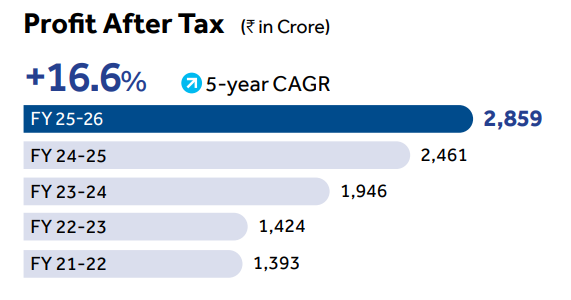
PAT increased from ₹1,393 crore to ₹2,859 crore during the same period, a CAGR of approximately 16.6%. In FY26, PAT was equivalent to nearly 62% of total income, reflecting the unusually high profitability of the asset-light business model.
Asset management requires very little physical capital. HDFC AMC does not need to build factories or maintain large inventories to increase AUM. Growth mainly requires investment in people, research, technology, compliance and distribution.
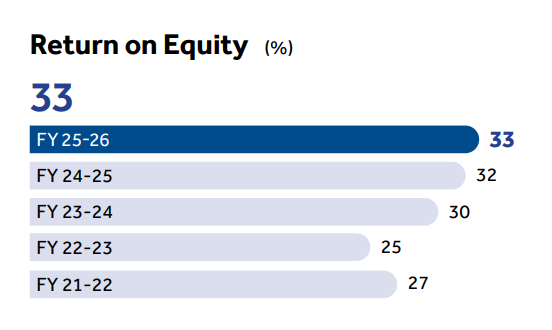
The company also operates without debt and generates more cash than it needs for regular expansion. As a result, return on equity increased from around 27% in FY22 to 33% in FY26, despite the company carrying a sizeable treasury portfolio on its balance sheet.
Since the business requires limited incremental capital, a large part of the profit can be distributed to shareholders. HDFC AMC’s dividend payout increased from around 64% of PAT in FY22 to approximately 81% in FY26.
This makes the company’s financial model relatively straightforward. AUM growth expands the revenue base, a higher active-equity mix protects fee yields, digital servicing controls costs and the resulting surplus cash is largely returned through dividends.
Peer Comparison: HDFC AMC’s Edge Is AUM Quality
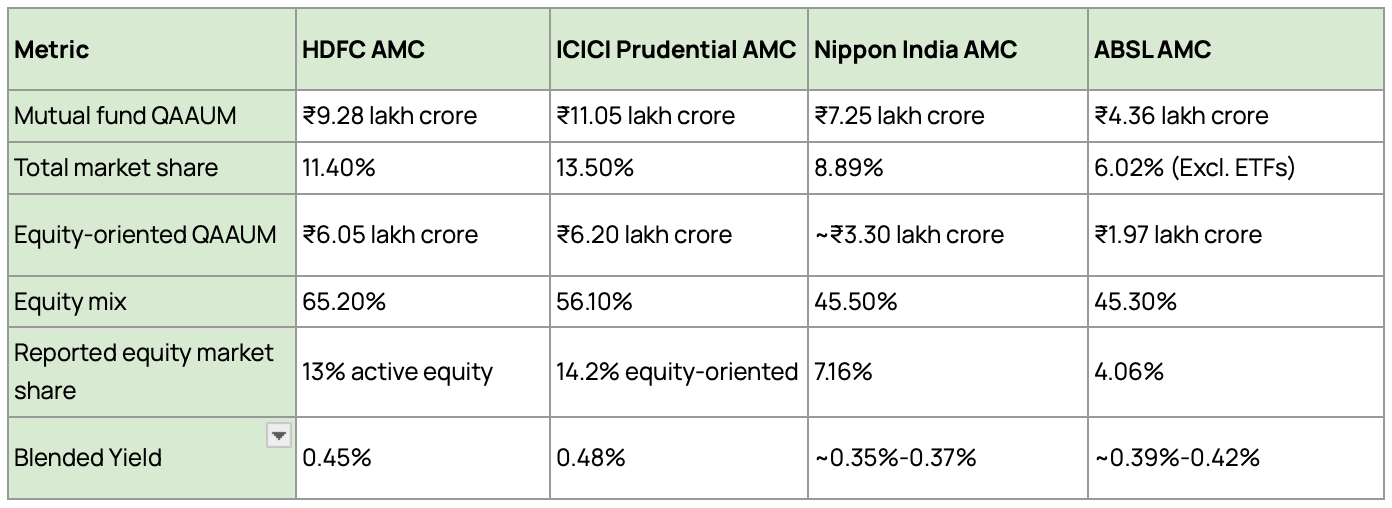
ICICI Prudential AMC is the largest of the four and also leads in equity-oriented AUM and market share.
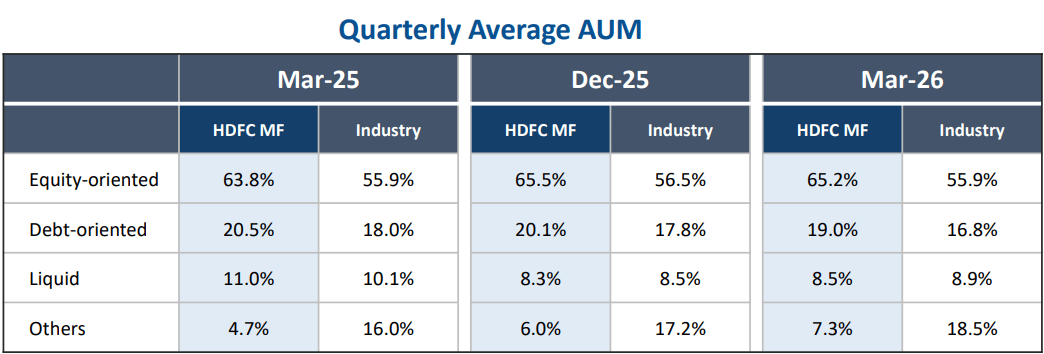
HDFC AMC’s key advantage is the quality of its AUM. Equity-oriented schemes account for 65.2% of its assets, significantly higher than those of all three listed peers. This allows HDFC AMC to earn higher blended fee yields than Nippon and ABSL AMCs.
HDFC AMC relies on volume and asset mix, pushing a higher overall percentage of its investors into the equity basket. However, ICICI Prudential relies on pricing power, extracting substantially higher revenue per Rupee managed across its active equity and debt portfolios.
This higher pricing power more than compensates for its lower overall equity contribution, resulting in a higher blended yield.
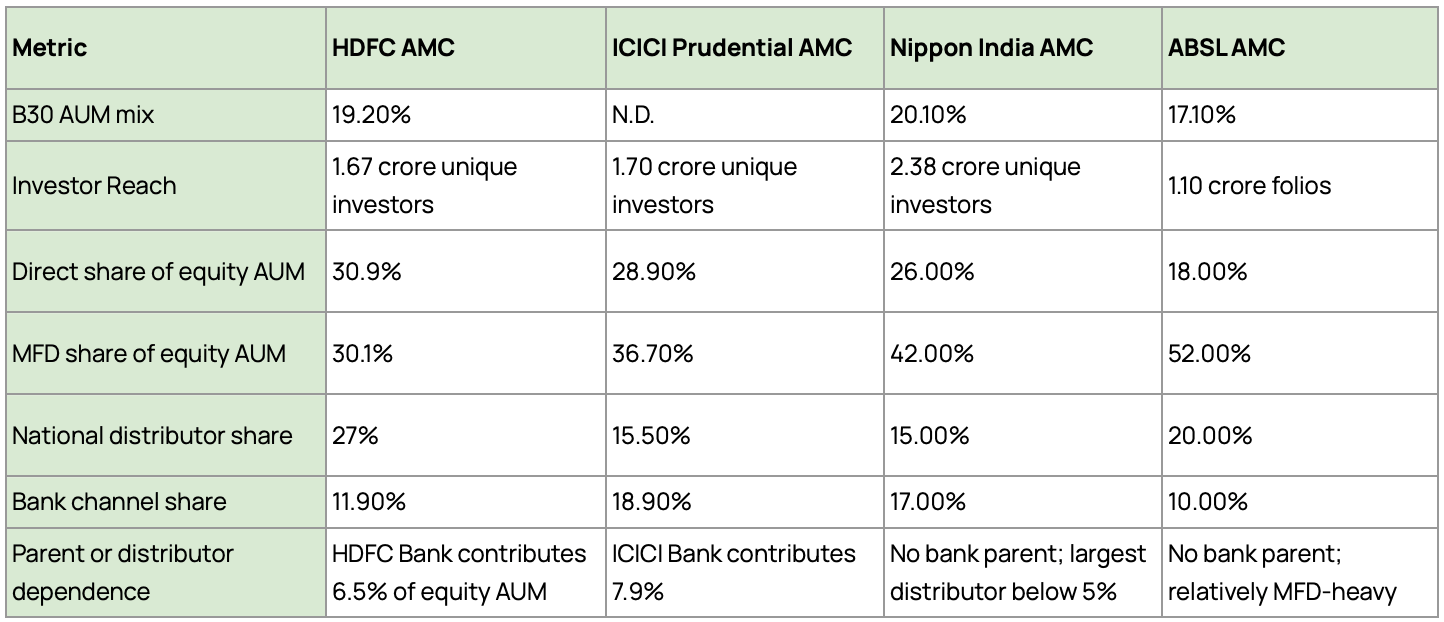
Nippon India AMC has the widest unique investor reach. However, HDFC AMC has the most retail-oriented asset base, with individuals contributing 68.2% of AUM.
ABSL AMC remains more dependent on traditional distributors, with MFDs contributing 52% of equity assets. HDFC AMC has a more balanced sourcing mix across direct plans, MFDs, national distributors and banks.
HDFC Bank contributes only 6.5% of equity AUM, showing that the company is not overly dependent on its parent for growth.
ICICI Prudential AMC leads in absolute scale. Its ₹11.05 lakh crore QAAUM and 14.2% equity-oriented market share make it HDFC AMC’s closest and strongest competitor.
Overall,
HDFC AMC stands out in AUM quality.
Its superior economics come from a better asset mix and tighter cost structure, not merely from being one of the industry’s largest players.
What Can Go Wrong?
Every attractive industry eventually attracts competition, regulation and disruption, and the AMC industry is no different.
When we look at HDFC AMC, there are three risks worth paying attention to.
1. Regulatory Changes Can Squeeze Profitability
SEBI’s objective is to make investing cheaper and more transparent for investors. While that is positive for investors, it can directly impact the revenue retained by fund houses.
The recent removal of the additional 0.05% charge linked to exit loads is a good example. On an active equity AUM base of roughly ₹44 lakh crore, this seemingly small change translates into an industry-wide revenue impact of around ₹2,200 crore annually.
Further changes, such as a potential move towards a Base Expense Ratio framework and the separation of statutory levies from fund-management charges, could create additional pressure on pricing.
Another structural challenge: As schemes become larger, SEBI’s telescopic fee structure automatically reduces the expense ratio that AMCs can charge.
HDFC AMC can partly offset this through digital servicing, lower distributor payouts and tight cost control. Even so, continued fee compression remains an important risk to watch.
2. Passive Funds Are Growing Faster
HDFC AMC currently earns around 0.56-0.59% on active equity assets. Index funds and ETFs generate only a fraction of that yield.
Meanwhile, passive fund AUM has grown rapidly, increasing from ₹6.98 lakh crore in March 2023 to ₹14.12 lakh crore in March 2026; a growth of 102% in just three years.
The impact is already visible.
HDFC AMC’s blended equity yield in Q4 FY26 was around 0.56%. Excluding index funds, active equity and equity-oriented funds earned around 0.60%-0.61%.
In other words, passive products are already pulling down the blended yield.
To put the difference into perspective:
HDFC Nifty 50 ETF charges an expense ratio of around 0.05%
HDFC Nifty 50 Index Fund Direct Plan has a TER of around 0.31%
Active equity funds earn materially higher fee yields
Passive products also tend to have a different investor profile. Around 68% of passive AUM is held by institutions, while direct channels account for roughly 60% of distribution.
As a result, passive growth can increase industry AUM while simultaneously reducing the blended revenue yield earned by AMCs.
Today, passive products account for around 18.7% of industry assets. Their share could continue increasing if active funds fail to consistently outperform benchmarks.
3. The Fight for Household Savings Is Intensifying
HDFC AMC is also competing with:
Other AMCs
New fund houses
Fintech platforms
Robo-advisory models
Insurance products
Alternative investment products
As the industry grows, attracting and retaining investor flows will become increasingly competitive.
Our View
Mutual fund penetration in India is still low, household savings continue to move towards market-linked assets, and the industry’s growth runway remains long. The company generates massive free cash flow, which enables it to be agile and ready with a war chest. Such companies can alternate between active and hibernation modes, depending on market conditions, and can capitalise on the distress sale of a competitor, explore adjacent verticals and are a bet on India’s growing Mutual fund AUM.
We leave the final decision to you, but the stock is definitely on our watchlist.
DeepScan is designed to help you think better about businesses. For investors looking for stock ideas backed by detailed research, there’s Finology 30.
Finology’s Exclusive Updates
From Ticker: The “Grid Lock” Opportunity
India is adding renewable energy rapidly, but the power grid needs major upgrades to support it. This has created strong demand for transformers, transmission lines and high-voltage switchgear.
How to Spot the Winners on Ticker
Order Book-to-Sales: Look for companies with order books 3-4x annual revenue.
CWIP Growth: Rising Capital Work in Progress can signal capacity expansion.
DuPont Analysis: Ensure ROE is driven by margins and asset turnover, not debt.
Pro-Tip: Track Inventory Turnover Days. Falling inventory days can indicate strong demand and faster cash conversion.
Renewable projects need transmission infrastructure. The companies building the grid could be among the biggest beneficiaries of this trend.
That’s a Wrap for Today!
We’re always looking for interesting businesses and industries to explore.
If you enjoyed this DeepScan, we'd love to hear from you. And if there's a company, industry, or business model you'd like us to break down next, simply reply to this email or drop a comment.
Disclaimer
The information and analysis provided herein are for educational and informational purposes only and do not constitute investment advice, a research recommendation, or an offer, solicitation, or recommendation to buy, sell, or hold any security. Investors should exercise their own judgment, conduct independent due diligence, and consult professional advisers before making investment decisions. Finology Ventures Private Limited, its affiliates, directors, employees, and research analysts shall not be liable for any loss or damage arising from the use of or reliance on this information.
SEBI Registered Research Analyst Details:
Registered Name : Finology Ventures Private Limited (RA Division)
Registration No : INH000024277
BSE Enlistment No. : 6877
Validity : Dec 16, 2025 - Dec 15, 2030
NCC ltd company deep scan