
DeepScan #9: Angel One Ltd.
How much more can a broker build around its customer base?

Hello,
This is the 9th edition of our DeepScan series, where we analyse one business each week with brutal honesty.
Last week, we dissected Motilal Oswal’s model and demonstrated why viewing it solely as a stockbroker overlooks the broader business.
Now this week, we’ll shift our focus to Angel One, still a stockbroker, but its growing customer base and expanding product offering raise a different question: How much more can it build around broking?
So let’s dive right in!
Note: This DeepScan is an educational analysis, not a stock recommendation. Its purpose is to help you learn how we analyse businesses. If you’re looking for actionable stock recommendations, explore Finology 30.
Want to know how Finology 30 stocks have performed over time?
Opt in and get our detailed performance report straight to your inbox.
India’s capital markets have expanded dramatically over the last two decades, but the growth has come in three distinct phases:
Phase 1: FY05-FY15, Traditional-Broker Era- This period was dominated by traditional brokers, physical KYC and relatively low investor awareness. Demat accounts increased from around 73 lakh in FY05 to 2.33 crore in FY15, implying a CAGR of around 12%.
Phase 2: FY15-FY20, Digitisation and the Rise of Discount Brokers- Aadhaar-based e-KYC, increasing digitisation, and the emergence of tech-led discount brokers started reducing the friction involved in opening and operating investment accounts. Demat accounts increased from 2.33 crore in FY15 to around 4.1 crore in FY20, a CAGR of roughly 12%.
Phase 3: Post-FY20, Mass Retail Participation- The biggest acceleration, it was supported by rising household savings, strong equity-market returns, easy-to-use trading apps and rapid adoption of digital investment platforms. Demat accounts surged from around 4.1 crore in FY20 to 19.25 crore in FY25, a CAGR of roughly 36%, and increased further to around 23.4 crore by July 2026.
But get this: despite the rapid growth in recent years, India’s capital-market penetration remains relatively low. As of March 2026, we had around 12.2 crore unique Demat investors, implying penetration of only around 12% of the adult population.
And the actual market participation is even lower!
NSE had around 4.55 crore active clients, equivalent to just 4-5% of India’s adult population. An active client is defined as someone who has executed at least one trade in the previous 12 months. This suggests that a large part of the country is still outside the formal investing ecosystem.
The opportunity becomes clearer when compared with the US, where active broking-account penetration is estimated at around 62% of the adult population. The runway is >10 times larger than in developed countries like the US.
Discount brokers dominate the industry – NSE active clients
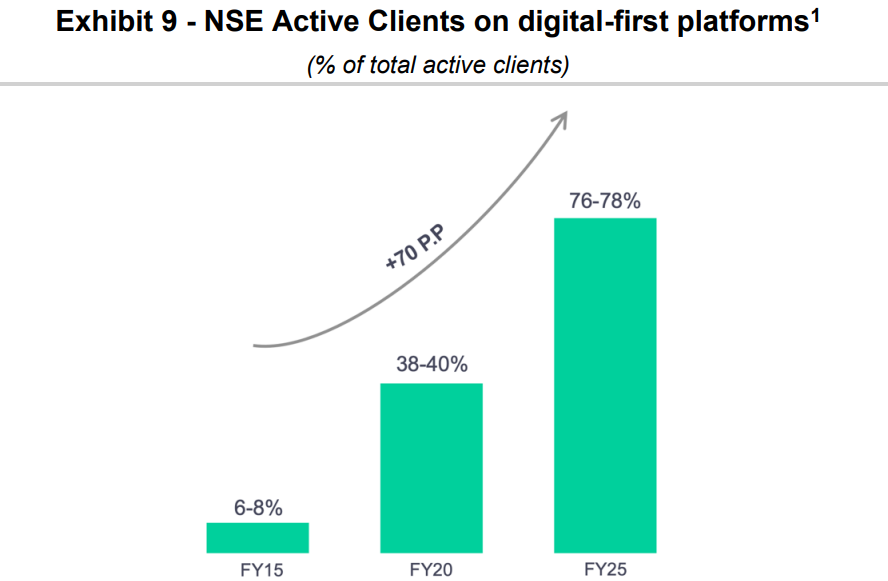
Digital-first investment platforms have taken a much bigger share of India’s broking market over the last decade. Their share of NSE active clients rose from just 6-8% in FY15 to 38-40% in FY20 and 76-78% by FY25. They also captured around 85% of all new active clients added between FY20 and FY25.
Investing has become much easier, with low-cost trading, real-time market information, research tools, and instant order execution through simple mobile apps. This better user experience has helped them gain market share from traditional brokers.
One important caveat is that the market has become highly concentrated. As of June 2026, Groww, Zerodha and Angel One together controlled around 58% of NSE active clients.
So while the overall market still has plenty of room to grow, a large share of new investors is already going to a few big platforms. For smaller brokers, gaining market share is becoming harder as brand, technology, product range and customer acquisition increasingly favour the largest players.
Let us now look at one of the largest listed players in India’s broking industry.
Angel One
It began in 1996 as Angel Broking, a traditional full-service broker built around branches, dealers and a large network of authorised partners.
The business started changing around FY20, when the company began a major digital transformation. It moved towards simpler pricing, online account opening and technology-led customer acquisition, helping it compete more directly with new-age discount brokers.
It later rebranded as Angel One and expanded well beyond broking into mutual funds, credit, wealth management, asset management, and insurance.
Today, Angel One is the third-largest broker in India by NSE active clients, behind Groww and Zerodha. As of June 2026, it had around 66.3 lakh active clients, translating into roughly 14.6% market share of NSE’s 4.55 crore active clients.
Broking still remains its core business and the main engine for acquiring customers. However, the larger strategy is to use this customer base to cross-sell more financial products over time.
So, what are customers paying Angel One for?
A dissection of the revenue mix reveals just how much of the business still rests on broking.
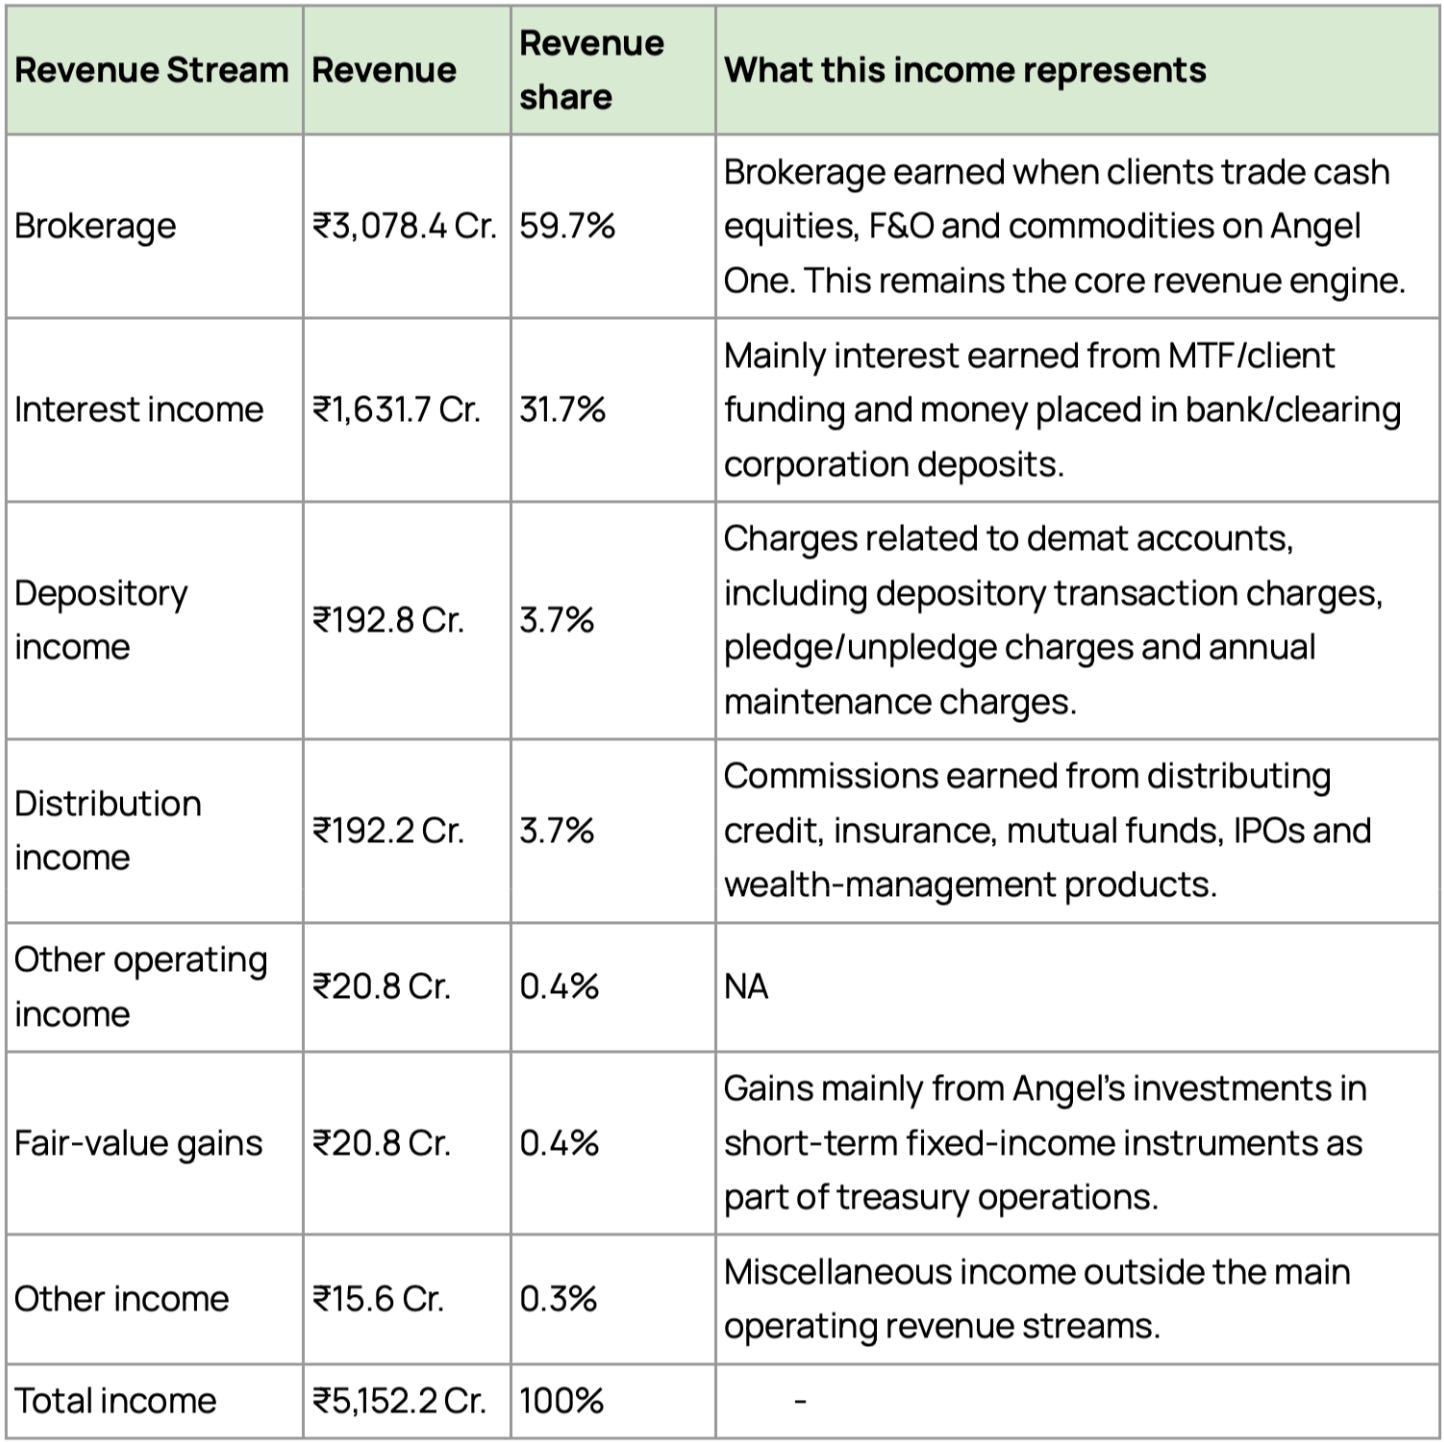
Broking contributed almost ~60% of total income.
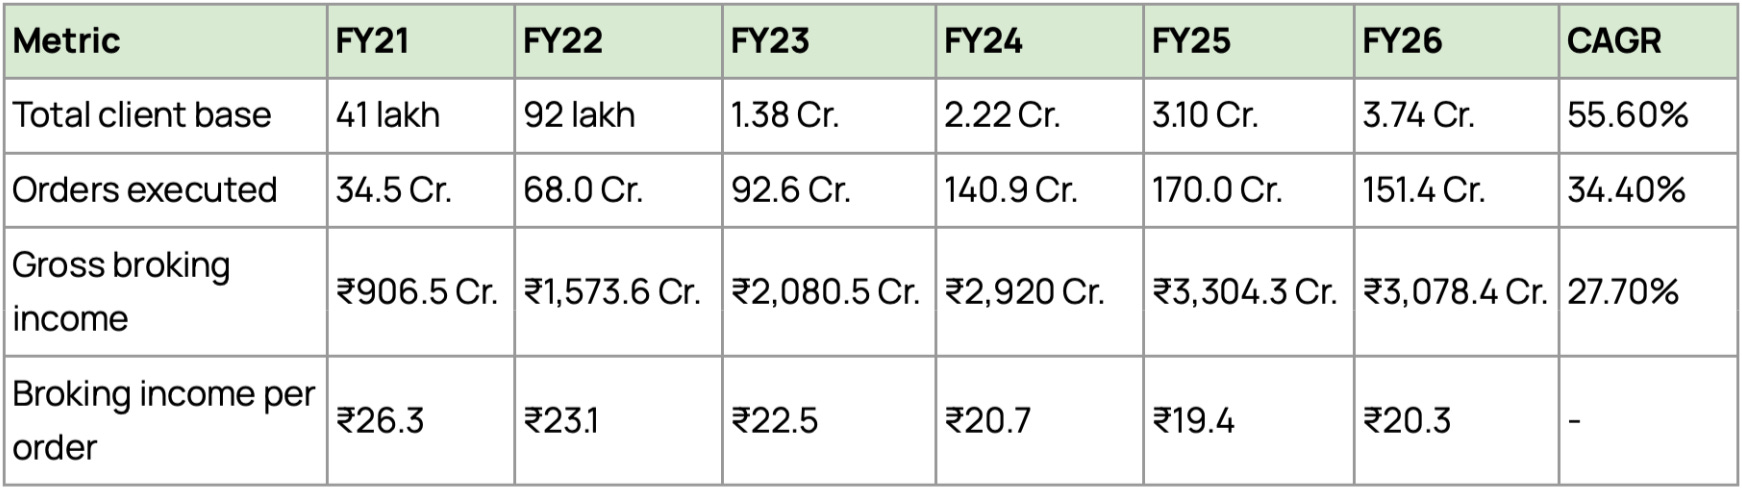
A broker ultimately makes money when customers remain active, transact frequently and route a meaningful share of their trading through the platform.
Trading wallet share tells a better story than account openings.
FY26 is a good example.
FY26 showed an interesting divergence in Angel One’s broking business. NSE active clients declined 10.8% YoY to 68 lakh, and total broking orders fell 10.9% to 151.4 crore, partly reflecting the impact of tighter F&O regulations and softer market activity. Yet Angel’s overall equity ADTO, or Average Daily Turnover, which measures the average value of trades executed by its clients on a typical trading day, jumped 86.7% to a record ₹1.6 lakh crore per day.
This helped Angel increase its overall retail equity turnover market share to 20.2%, even though its share of NSE active clients was much lower at 14.8%.
In simple terms, Angel has a smaller share of active customers than its share of trading activity. This suggests that an average active Angel customer trades more than the industry average, particularly in derivatives.
This is very different from Groww.
Groww has nearly 29% of NSE active clients, almost twice Angel’s share, but its Q1 FY27 market share was only around 15.1% in cash equities and 11% in derivatives. The difference largely comes from how the two businesses developed.
Angel started as a broker and built a customer base with a stronger trading orientation, supported by both its digital platform and assisted distribution network.
Groww, on the other hand, started with mutual funds and built a much larger base of younger and first-time investors, many of whom trade less frequently.
This allows Angel to generate significant broking activity from a smaller active-client base. But the advantage may narrow if Groww’s customers become more active over time and increase their participation in equities and derivatives.
Over FY20-26, Angel’s overall equity ADTO grew at an estimated ~26% CAGR, compared with roughly ~18% CAGR for the broader retail market.
Take a look at the latest numbers that continue to show a strong trading franchise:
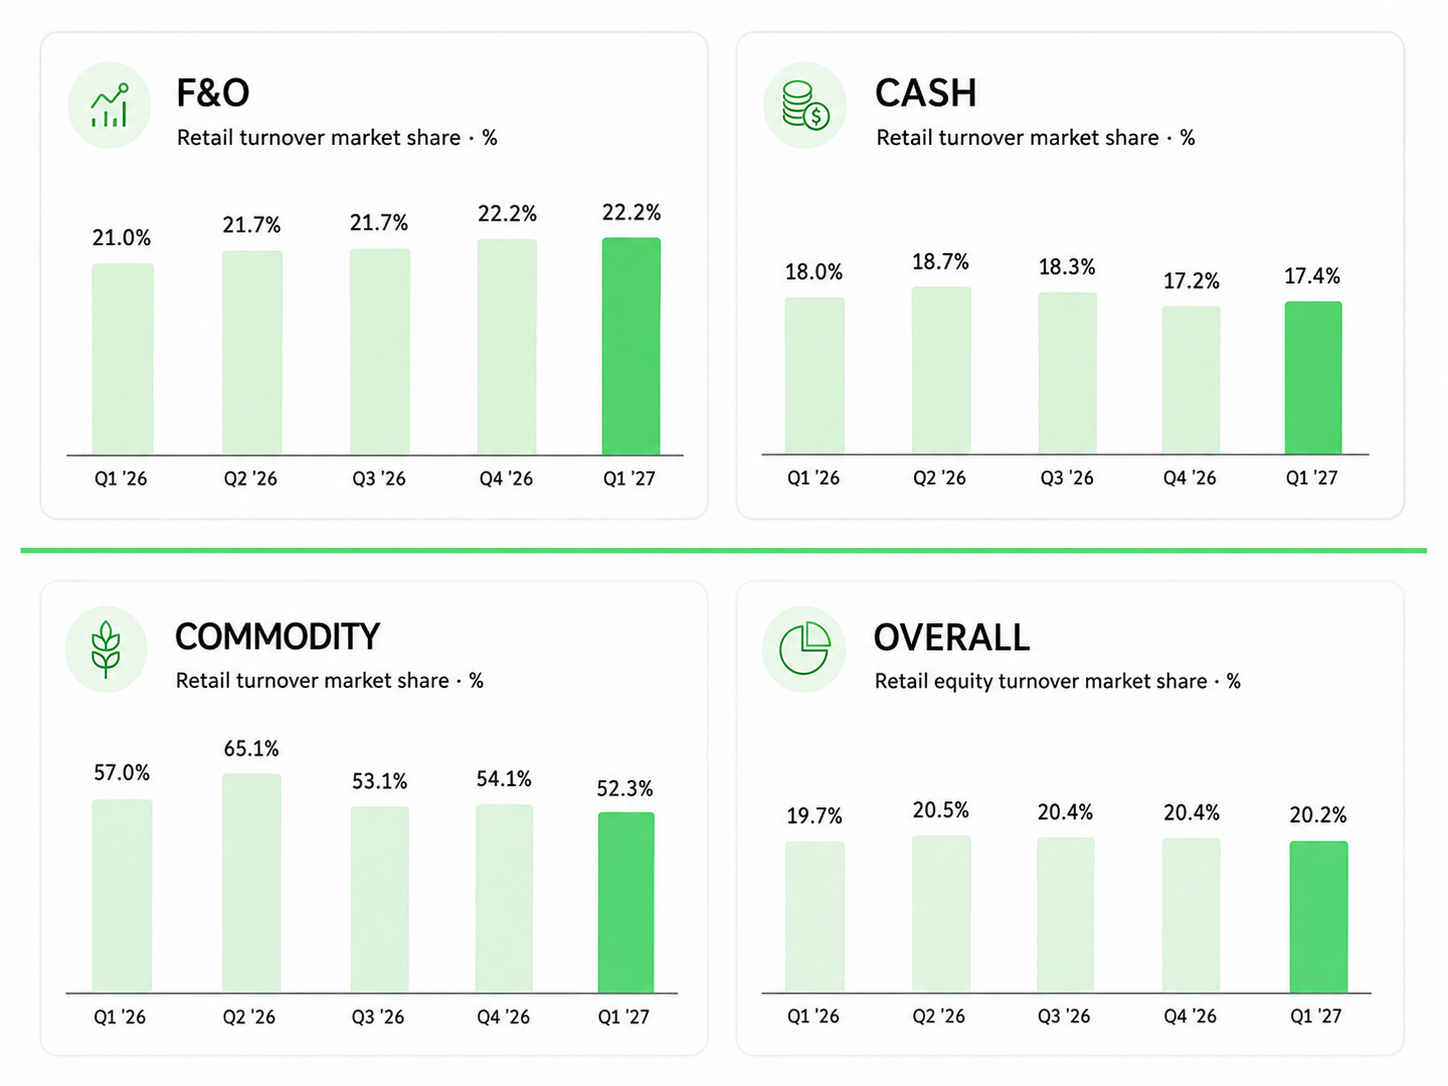
Angel One is gaining share in derivatives, where it now accounts for roughly one-fifth of retail equity turnover. Cash-market activity, though, has been a little softer.
F&O remains the real earnings engine.
Angel’s strongest competitive position is in equity derivatives.
In Q1 FY27, Angel handled 30 crore F&O orders, up from 24.1 crore a year ago, while its retail F&O turnover market share increased from 21.0% to 22.2%. Nearly 74% of all orders executed on Angel’s platform during the quarter were F&O orders.
Around 45% of the company’s revenue came from F&O in Q1 FY27.
Between FY20 and FY26, Angel’s equity-derivative orders grew at roughly 83% CAGR, while its F&O turnover market share expanded by about 16.5% to 22.2%.
Angel has a much deeper trading franchise than its client count suggests, BTW.
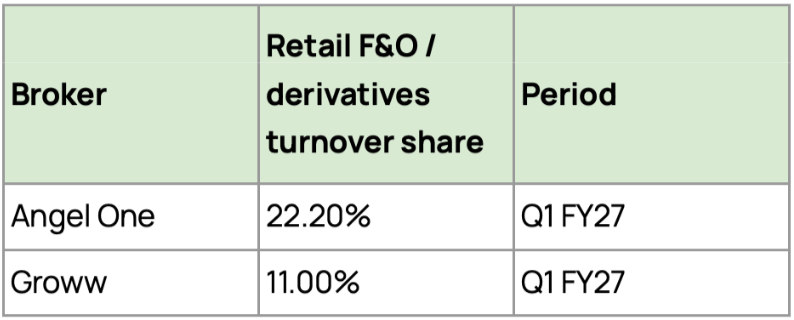
The more encouraging part is that Angel has held its ground through the F&O regulatory reset. Its retail equity-derivatives turnover share increased from 21.0% in Q1 FY26 to 22.2% in Q1 FY27. Groww, despite gaining rapidly, was at 11.0%, up from 7.2% a year earlier. Angel therefore still handles roughly twice Groww’s share of retail equity-derivatives turnover.
The contrast with Groww is particularly interesting. As of June 2026, Groww had around 1.31 crore NSE active clients, almost twice Angel’s 66 lakh, yet its derivatives turnover share was only 11% compared with Angel’s 22.2%. This reinforces the point that Angel’s customer base is materially more trading-intensive, especially in derivatives.
There is also evidence that F&O acts as an entry point rather than the final destination for many customers. Only around 10% of first-year customers trade exclusively in F&O, falling to about 5% by the sixth year, while participation in cash or cash plus F&O rises to around 95%. This reduces some of the concern around F&O dependence because Angel can potentially migrate traders towards investing, MTF and other financial products over time.
F&O is also its biggest vulnerability.
This is why the diversification story needs some perspective. Angel has added many products, but its revenue mix has diversified much more slowly than its product menu.
In October 2024, SEBI introduced measures to reduce excessive speculation in index derivatives. The changes included restricting weekly expiries to one benchmark index per exchange, increasing index-derivative contract values to around ₹15-20 lakh, collecting option premium upfront and tightening risk controls around expiry-day positions.
Together, these measures made frequent F&O trading more capital-intensive and reduced the number of short-duration contracts available to traders.
The impact was visible almost immediately.
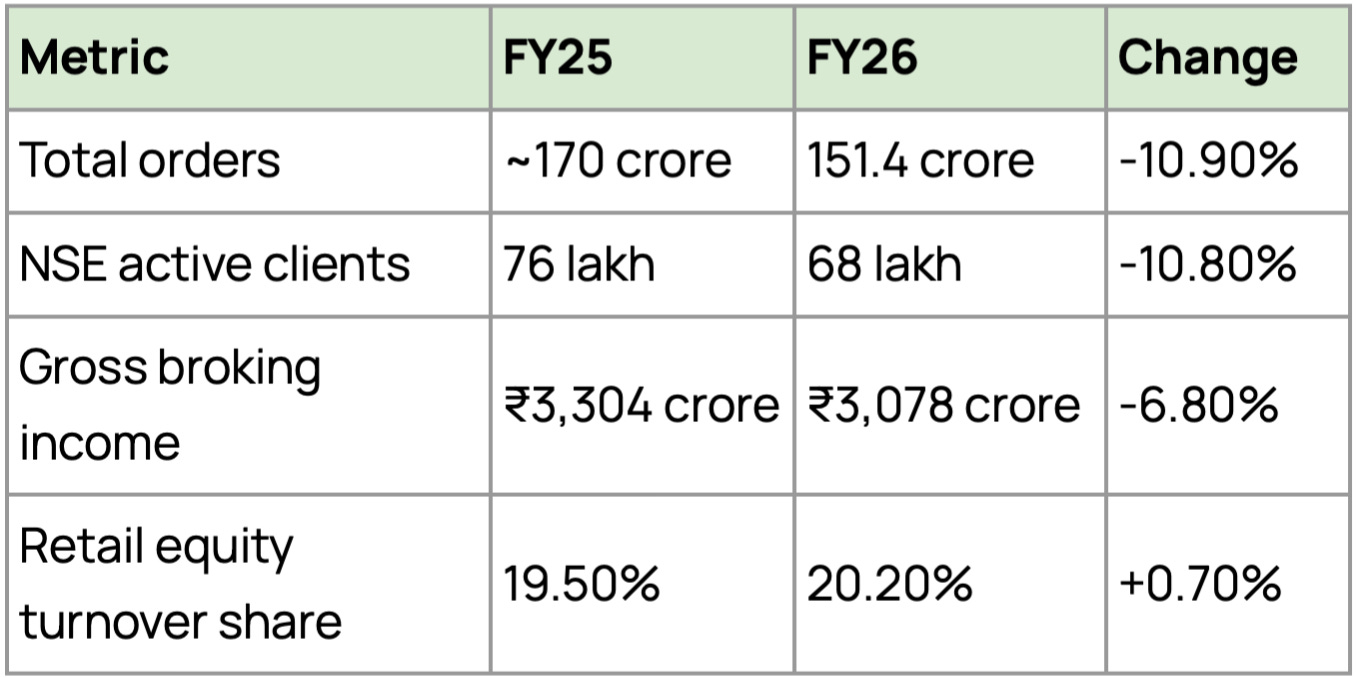
The slowdown was industry-wide.
SEBI’s subsequent study found that individual investor derivatives premium turnover fell by 11% YoY, and the number of unique derivatives traders declined by 20% after the regulatory measures took effect.
The risk: If another regulatory change materially reduces retail derivatives activity, Angel could simultaneously see pressure on orders, brokerage income and customer engagement.
Cash equities are becoming the key battleground for competition.
In Q1 FY27, the cash segment contributed around 9% of Angel’s gross revenue. Angel executed 6.7 crore in cash orders during the quarter and accounted for 17.4% of retail cash-market turnover.
Between FY20 and FY26, Angel’s average daily cash grew at around 21% CAGR, while its retail cash-market share increased by 4.31% to 17.2% by Q4 FY26.
Check out how the recent trend shows distress and signs of increasing competition.
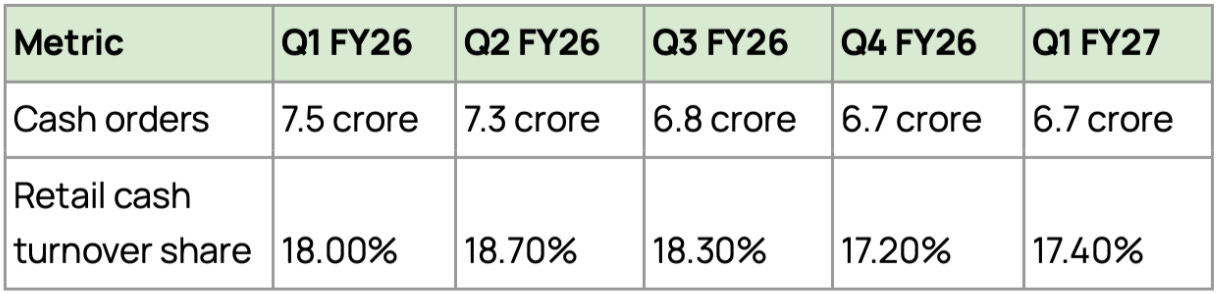
Cash orders declined around 11% YoY in Q1 FY27, while market share slipped 0.6% from 18.0% to 17.4%. So unlike F&O, where Angel continues gaining share, the cash franchise has broadly plateaued over the last few quarters.
Observe the competitive picture now…
Groww’s retail stock ADTO market share increased from 11.8% in Q1 FY26 to 15.1% in Q1 FY27, a gain of 3.3% in just one year. Angel, meanwhile, moved from 18.0% to 17.4%.
This is probably the most important competitive trend within Angel’s cash business.
Groww already has a much larger customer-acquisition franchise. It does not need another major jump in customers to overtake Angel in cash turnover. It only needs to continue increasing trading activity among customers already on its platform.
The positive development is that Angel is getting better at monetising the cash activity it already has.
In November 2025, the company simplified pricing across cash delivery and intraday transactions to 0.1% of transaction value, capped at ₹20 per executed order with a minimum brokerage of ₹5. Management estimated that the pricing change could add around ₹50-60 crore annually to net revenue, with most of the benefit flowing through to PBT.
The impact is more visible at this point.
Cash brokerage contributed 7.3% of gross revenue in Q4 FY26, but increased to around 9% in Q1 FY27 even though cash orders remained unchanged at 6.7 crore. Management indicated that cash brokerage realisation increased from roughly ₹15-16 per order to close to ₹19 in Q1 FY27
There is also a competitive trade-off here. Angel now charges brokerage on equity delivery the same as Groww, whereas Zerodha continues to offer zero brokerage on delivery transactions and charges the lower of ₹20 or 0.03% for intraday trades.
Cash equities are worth more than the brokerage they generate.
A cash customer can generate revenue for Angel in multiple ways:
Brokerage income when stocks are bought or sold. MTF can increase this opportunity because customers can take larger equity positions than they could using only their own capital, potentially driving higher trading activity and more brokerage-generating transactions.
Interest income through MTF, where Angel funds part of the stock purchase and earns interest on the outstanding amount.
Depository income when delivery shares are sold, pledged or transferred.
This makes MTF particularly valuable. The same product can support both brokerage revenue through higher cash-equity activity and recurring interest income on the funded amount. As the MTF book grows, Angel therefore benefits not only from the interest spread but potentially from deeper cash-market engagement as well.
Commodities make for a small but dominant third broking engine.
Commodity broking is much smaller than F&O and cash equities in revenue terms, but it is actually Angel One’s strongest business by market share.
In Q1 FY27, Angel executed 4 crore commodity orders, up 48% YoY from 2.7 crore, while its retail commodity turnover market share stood at 52.3%.
Between FY20 and FY26, Angel’s commodity ADTO grew at roughly 81.6% CAGR, significantly faster than the broader market’s 58.6% CAGR. Over the same period, Angel’s commodity market share increased by 39.5%, from roughly 14.6% to 54.1%, while commodity broking revenue grew at around 27.3% CAGR.
Angel is the clear leader, but competition is rising.
Groww has also been scaling quickly in commodities. Its retail commodity notional ADTO market share reached 28.6% in Q1 FY27, compared with Angel’s 52.3%.
While market share has fallen from the 65.1% peak, absolute orders have increased sharply. Management attributes part of this to rapid expansion of the overall commodity market as more retail customers enter the segment.
Commodity revenues are also closely linked to market volatility. For example, Q4 FY26 benefited from strong activity in gold, silver and energy commodities, helping commodity brokerage income grow 15.8% QoQ. Management has cautioned that activity and brokerage realisation can move materially depending on volatility in bullion, crude oil and other contracts.
Commodities give Angel a useful revenue stream outside equity derivatives, and its 52%+ market share represents a genuine competitive strength. The business has also grown materially faster than the industry over the last six years.
MTF and Client Funding are the second monetisation engine.
Margin Trading Facility, or MTF, is becoming an increasingly important part of Angel One’s cash-equity business.
It contributes ~16% of consolidated total income.
The product is fairly simple.
A customer buys shares by paying only part of the purchase value, while Angel funds the rest.
Depending on the stock and the prescribed margin, Angel can provide up to 4x leverage on the customer’s own capital.
The customer then pays interest on the funded amount until the position is closed or converted into delivery.
MTF is regulated, so brokers cannot give unlimited leverage or fund any stock. It is allowed only on Group I shares and Group I equity ETFs, which are essentially relatively liquid securities that trade regularly and can be sold without causing a large price impact. This reduces the risk of brokers getting stuck with illiquid shares if a customer fails to meet margin requirements.
The customer must also bring in a minimum margin, which varies by stock. This is why Angel can offer up to around 4x buying power, but not on every stock.
For example, if the required margin is 25%, a customer can buy ₹1 lakh worth of shares with ₹25,000, and Angel funds the remaining ₹75,000. If the required margin is higher, the leverage automatically comes down.
There are limits on Angel as well.
There are limits on Angel as well. A broker’s total MTF exposure cannot exceed its MTF borrowings plus 50% of regulatory net worth, while total MTF-related borrowings cannot exceed 5x regulatory net worth. Exposure to any single customer is capped at 10% of the broker’s maximum allowable MTF exposure.
The shares bought through MTF remain pledged as collateral. If their value falls below the required margin, Angel One can ask the customer to bring in more money or sell the pledged shares.
For Angel, this creates a second way to monetise the same equity customer. It earns interest on the funded amount, while higher position sizes can also lead to more cash-equity trading and brokerage activity.
The funding book has also picked up pace.
Between FY21 and FY26, Angel’s period-end client funding book grew at roughly 36% CAGR. Growth accelerated further in Q1 FY27, with the period-end book rising around 31% in just one quarter to ₹7,153 crore, while the average funding book reached ₹6,140 crore.
In FY26, the average funding book increased 45.3% to ₹5,300 crore. This helped client-funding interest income grow 38.6% to ₹840 crore, from around ₹610 crore in FY25.
This is why MTF should not be seen only as an interest-income business.
A customer with ₹1 lakh of capital can potentially take a much larger equity position using funding. That can increase both the amount of money deployed through Angel’s platform and the brokerage-generating activity from the same customer. Yet…
Despite the rapid growth, MTF adoption remains very low.
Only around 3.65 lakh customers were using the client-funding product as of June 2026, compared with Angel One’s 3.86 crore registered users. This means penetration is still below 1% of the total customer base.
And that leaves a meaningful runway. Because as existing customers become more active and allocate more money to equities, Angel can potentially grow MTF without relying entirely on new customer acquisition. The same customer can generate higher interest income as well as additional brokerage activity.
Pricing, however, is unlikely to be the key differentiator.
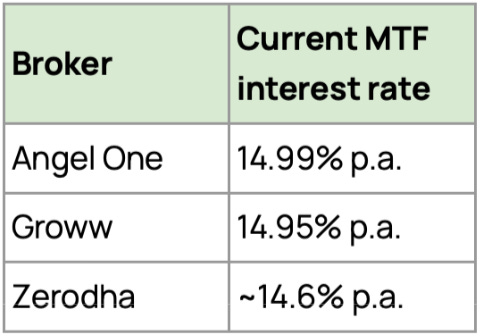
Rates have largely converged across the major digital brokers. The competitive advantage, therefore, comes from customer scale, product discovery, available funding capacity, risk management, and the ability to convert existing equity investors into MTF users.
The main risk is what happens when markets fall sharply.
As of Q1 FY27, 83% of client-funding exposure was below ₹1 lakh per customer, another 10% was between ₹1 lakh and ₹5 lakh, and only 7% was above ₹5 lakh. Around 85% of the book was less than 30 days old. The exposure is also secured against customers’ Demat holdings, while the company reports negligible delinquencies.
Sure, this reduces credit risk, but it does not remove market risk.
A sharp decline in stock prices can trigger margin shortfalls, forcing customers to bring in more collateral or reduce their positions. As a result, the funding book can shrink exactly when markets are weak. MTF is therefore still a market-sensitive and pro-cyclical business, even if actual credit losses remain low.
There is another important trade-off…
MTF is capital-intensive.
Unlike broking, which can scale largely through technology, MTF requires Angel to raise funds and lend them onward to customers. Every increase in the funding book therefore also increases the need for balance-sheet capital and borrowings.
This was visible in FY26. Angel generated around ₹1,960 crore of operating profit before working-capital changes, but cash flow from operations was negative ₹4,142 crore as more capital was deployed into the client-funding book and other working-capital requirements. The company also needed funds for margins placed with clearing corporations.
Borrowings consequently increased sharply, from around ₹3,383 crore in FY25 to ₹7,879 crore in FY26, an increase of roughly ₹4,500 crore.
That is the key difference between MTF and brokerage.
Brokerage can scale with relatively little incremental capital. MTF can generate attractive interest income and deepen customer monetisation, but growth requires more balance-sheet funding.
For Angel, the opportunity is therefore significant because penetration is still below 1%. But the quality of that growth will depend on whether the company can expand the book without taking excessive funding, liquidity or market risk.
To put that scale in perspective, let’s see how Angel compares with Groww.
Angel vs. Groww
Groww is the biggest competitor for Angel One in the listed space
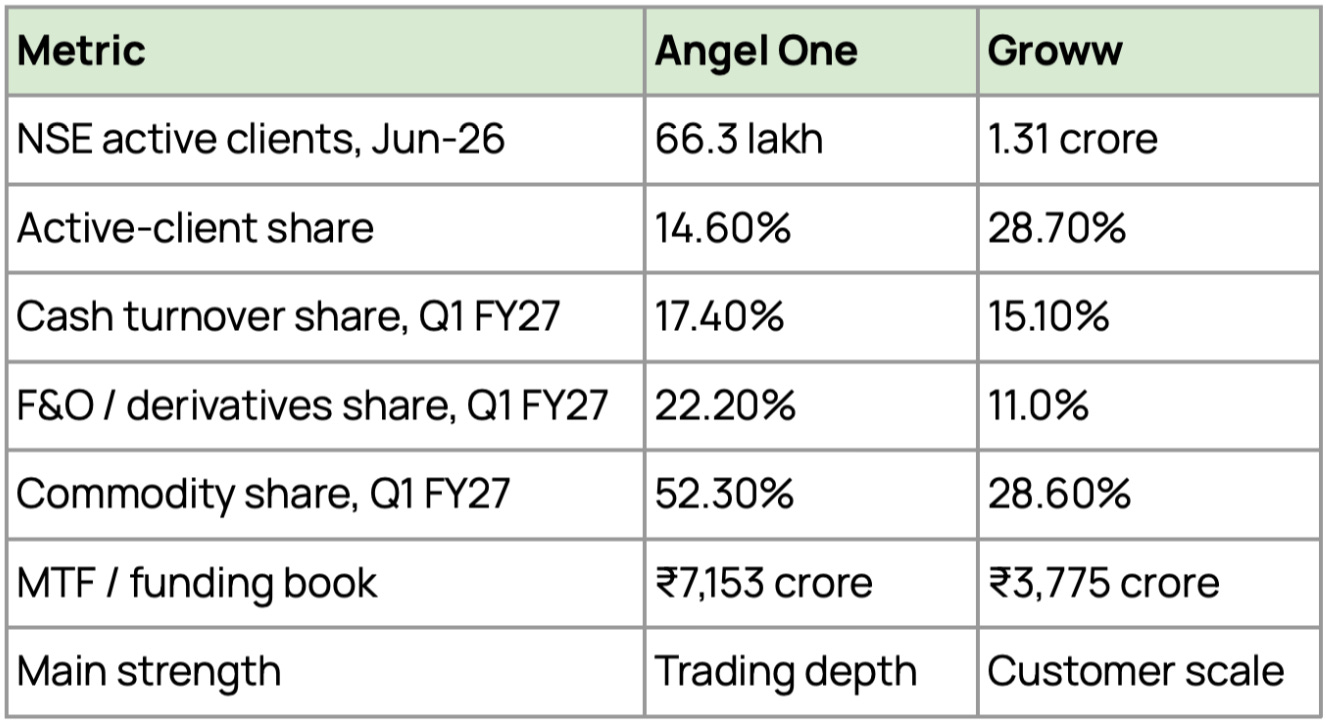
Groww has a much larger active customer base, with around 1.31 crore NSE active clients, compared with Angel One’s 66.3 lakh as of June 2026. Its active-client market share is also almost double at 28.7% compared with Angel One’s 14.6%. This gives Groww a much larger base that it can monetise over time.
Angel One, however, still has stronger trading activity per customer. In Q1 FY27, Angel had a 17.4% share in cash turnover, 22.2% in F&O and 52.3% in commodities, compared with Groww’s 15.1%, 11.0% and 28.6%, respectively. This suggests Angel’s users are generally more active traders, which helps it generate more revenue from a smaller customer base.
Customer acquisition is another area where the difference between Angel One and Groww becomes visible. Based on advertising and publicity spend divided by gross client additions, Angel’s estimated CAC proxy increased from around ₹840 in FY24 to ₹958 in FY25 and ₹1,187 in FY26. At the same time, first-year net income per acquired customer fell from roughly ₹700 to ₹554 and ₹453, suggesting that recent cohorts are taking longer to recover acquisition spending.
The positive is that Angel’s customers continue generating income for several years. The FY24 cohort regenerated around ₹2,850 of cumulative net income per customer by FY26, versus ₹700 in its first year. This supports Angel’s strategy of focusing on customer lifetime value rather than only first-year monetisation.
Groww currently appears stronger on upfront customer economics. Its CAC declined from around ₹1,020 in FY23 to ₹933 in FY24 and ₹815 in FY25, while more than 80% of customers were acquired organically and acquisition payback was estimated at around 4-6 months.
The trend suggests Groww is recovering acquisition costs faster, while Angel’s model depends more on customers staying longer and becoming more valuable over time.
The risk for Angel is that Groww does not need to continue adding customers at the same pace to remain competitive. If Groww can encourage its existing users to trade more frequently and use products such as MTFs and derivatives, the gap in trading share can narrow quickly.
But the headline numbers don’t tell you everything. That’s the kind of thinking we use when evaluating stocks for Finology 30.
That brings us to…
The businesses Angel hopes can grow alongside broking:
Wealth management: the most meaningful diversification opportunity
Ionic Wealth is scaling rapidly and could become Angel’s largest non-broking fee-income business. Wealth AUM increased from ₹3,790 crore in FY25 to ₹10,080 crore in FY26, and further to ₹13,440 crore in Q1 FY27. Around 91% of Q1 FY27 AUM was ARR-linked, implying roughly ₹12,230 crore of recurring-revenue-linked assets. The UHNI business alone managed ₹8,730 crore across 263 families, while the wealth-tech platform managed another ₹3,230 crore.
The management is deliberately increasing ARR-linked assets and has proposed another ₹150 crore capital infusion into the business. However, it remains in investment mode, and management has indicated that meaningful breakeven visibility could take around 3-4 years.
Credit: a large opportunity inside the existing customer base
Angel says its customers already borrow more than ₹1 lakh crore of personal loans annually from the broader market, while Angel itself distributed only around ₹2,010 crore in FY26. It served more than 90,000 borrowers through seven lending partners, which shows how small current penetration is relative to its customer base.
The existing personal-loan model is asset-light because banks and NBFCs provide the capital while Angel earns distribution income.
The next step is a Loan Against Securities through Angel’s own NBFC, where Angel will deploy its balance sheet and earn a lending spread.
Management expects LAS to become meaningful over the next 2-3 quarters and has proposed a capital infusion of up to ₹150 crore into the NBFC. This could improve monetisation, but it also adds capital intensity and credit risk.
Asset management
Angel AMC is still at an early stage. AUM reached around ₹620 crore in Q1 FY27, with 11 schemes across passive, smart-beta and commodity strategies. Management continues to focus largely on passive products rather than entering active mutual funds aggressively.
The biggest advantage is Angel’s captive distribution base, which can lower customer-acquisition costs for its own funds. The limitation is economics. Management has indicated average TERs of only around 0.25%-0.30%, so the AMC needs a much larger AUM base before it becomes financially meaningful. We therefore see AMC as a long-duration recurring-revenue opportunity rather than a near-term earnings driver.
Coming to the key risks involved…
New businesses could dilute margins and ROE for longer than expected.
In Q1 FY26, management said the incubation of wealth and asset management alone reduced normalised operating margin by around 2.6%. FY26 also showed meaningful losses across the wealth entities: Angel One Investment Services lost about ₹64 crore, Investment Managers & Advisors around ₹26 crore, Angel One Wealth around ₹12 crore, while the AMC lost another ₹13 crore. Together, these entities absorbed more than ₹100 crore of profit during FY26.
It can dilute ROE if they remain subscale for several years and continuously consume the profits generated by the mature broking franchise.
Leadership continuity in new businesses needs watching.
In the Q1 FY27 call, an analyst explicitly raised the issue of “massive churn” in top management, particularly in AMC. The management roster itself shows the change: Hemen Bhatia was CEO of Angel One AMC through FY26, while by the Q1 FY27 call, Murali Ramasubramanian was serving as Interim CEO.
Repeated senior churn can slow product launches, distribution execution and regulatory relationships. It matters more here because Angel is trying to build several new businesses simultaneously and needs specialist teams outside its traditional broking expertise.
Corporate governance risk
Angel One’s governance and compliance record needs to be watched closely. The company has faced regulatory issues in the past, including older SEBI cases related to artificial trading activity, while recent cases have mainly involved weak supervision of authorised persons and franchise partners. Angel settled a front-running-linked case in 2024 and paid ₹4.28 crore in June 2026 to settle another SEBI proceeding over alleged supervisory failures. Repeated compliance failures could hurt its reputation.
Lastly, the valuations...
Angel One currently trades at around 26x earnings, which is about 24% above its historical median P/E of 21x. The premium appears to reflect expectations that the core broking franchise will recover from the FY26 regulatory reset while MTF, wealth management, credit and distribution gradually become larger contributors to earnings.
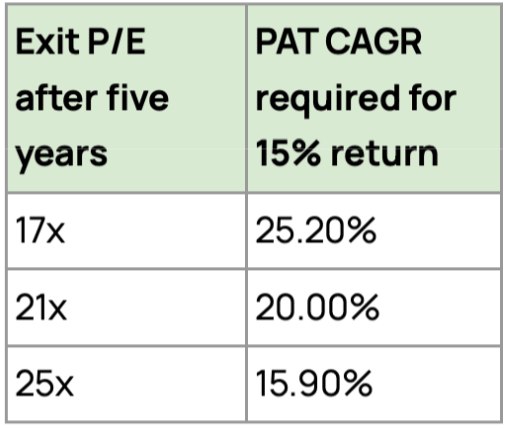
If Angel’s valuation returns to its historical median of 21x after five years, PAT would need to compound at roughly 20% annually to deliver a 15% annual return, excluding dividends. At the same 21x exit multiple, 15% PAT growth would generate only around 10.2% annual returns, while 18% growth would deliver roughly 13.1%.
Angel is also coming off a weak year, which makes the growth hurdle more meaningful. Consolidated PAT fell 21.9% in FY26 to ₹915 crore, from ₹1,172 crore in FY25, mainly because of tighter F&O regulations, the loss of True-to-Label revenue and higher investments in new businesses.
Q1 FY27 showed a strong recovery, with PAT rising 102% YoY to around ₹230 crore. However, this was partly helped by a weak base.
In our view…
Some premium to Angel’s historical valuation can be justified if the earnings mix improves. Wealth AUM is scaling rapidly, client funding continues to grow, and management expects distribution, wealth and asset management together to become a double-digit share of revenue over the next 3-5 years.
But these businesses are still small, and several remain in investment mode, while broking and broking-linked interest income continue to dominate earnings.
At 26x earnings, the valuation therefore already assumes a reasonably strong recovery and successful diversification.
Angel One has built a strong trading franchise, with around 20% share of retail equity turnover, but the competitive landscape is becoming tougher. Groww and Zerodha already have larger active customer bases, while Groww is steadily increasing its share in both cash equities and derivatives.
Angel’s key advantage is that its customers trade more actively, which has helped it maintain a much larger share of turnover than its active-client share would suggest. The challenge now is to defend this trading intensity while improving customer acquisition.
Finology’s Exclusive Updates
From Ticker: Active Skincare & Derma-Cosmetics
Personal care in India is rapidly shifting from basic mass-market soaps to science-backed active skincare. Daily grooming has transformed from a simple utility into a high-margin, recurring habit with deep consumer loyalty.
How to Spot the “Derma Champions” on Ticker:
Don’t buy commoditised FMCG players; use Ticker to isolate high-margin skincare leaders:
Expanding Gross Margins: Check the Profit & Loss tab - specialised active skincare commands significantly higher pricing power and profit margins than basic bath products.
Ad-to-Sales Efficiency: Check Documents for falling ad spend as a % of sales, proving revenue is driven by high repeat purchases rather than endless ad burning.
DuPont Analysis: Use this tool to verify that a high Return on Equity (ROE) is propelled by strong Net Profit Margins rather than debt.
Check Investor Presentations for Quick-Commerce revenue share. Instant delivery apps drive rapid inventory turns and immediate cash collections for top skincare brands.
That’s a Wrap for Today!
We’re always looking for interesting businesses and industries to explore.
If you enjoyed this DeepScan, we’d love to hear from you. And if there’s a company, industry, or business model you’d like us to break down next, simply reply to this email or drop a comment.
See you in the next edition!
Pranjal Kamra
Research: Jayesh Mohta
Editorial: Mehvish Qureshi
Disclaimer
Investment in securities market are subject to market risks. Read all the related documents carefully before investing. The information and analysis provided herein are for educational and informational purposes only and do not constitute investment advice, a research recommendation, or an offer, solicitation, or recommendation to buy, sell, or hold any security. Investors should exercise their own judgment, conduct independent due diligence, and consult professional advisers before making investment decisions. Finology Ventures Private Limited, its affiliates, directors, employees, and research analysts shall not be liable for any loss or damage arising from the use of or reliance on this information.
SEBI Registered Research Analyst Details:
Registered Name : Finology Ventures Private Limited (RA Division)
Registration No : INH000024277
BSE Enlistment No. : 6877
Validity : Dec 16, 2025 - Dec 15, 2030