
DeepScan #5: 360 ONE WAM Ltd.
A business built around India's richest families.

Hello,
One thing my team and I have loved while creating our DeepScan series is how every layer of the financial ecosystem has its own economics.
We’re using the same process here that we use to decide what goes into Finology 30. So if you’ve read the earlier editions, you already know what’s coming.
BTW, if you haven’t explored Finology 30 yet, that’s where we share the companies we believe deserve a place in a long-term portfolio.
Now, to the company we’re analysing this week.
Note: This DeepScan is an educational analysis, not a stock recommendation. Its purpose is to help you learn how we analyse businesses. If you’re looking for actionable stock recommendations, explore Finology 30.
After analysing asset management companies (HDFC, ICICI and Nippon) that primarily serve retail investors and the one on the distribution side of things (Prudent), we’ll now move further up the financial services value chain to wealth management companies, starting with 360 ONE.
As wealth grows, financial decisions become more interconnected. Investment allocation, tax efficiency, retirement, liquidity, estate planning and succession all influence one another. Wealth managers help clients navigate these decisions as a whole.
The objective is not only to grow wealth, but also to protect it, allocate it efficiently and transfer it smoothly to the next generation.
For companies such as 360 ONE, the industry opportunity is being driven by three structural trends.
More Indian households are becoming wealthy
Informally managed wealth is moving towards organised platforms
Affluent investors are shifting towards premium and more sophisticated financial products
The most important drivers being…
The rapid expansion of India’s affluent population:
India had just over 12,000 ultra-high-net-worth individuals in 2021. UHNIs are generally defined as people with wealth exceeding approximately ₹285 crore.
Their number increased to 19,877 by 2026, representing a CAGR of around 10.6% over five years.
The UHNI population is expected to rise further to 25,217 by 2031. This implies a CAGR of around 4.9% between 2026 and 2031, placing India among the six largest UHNI markets globally.
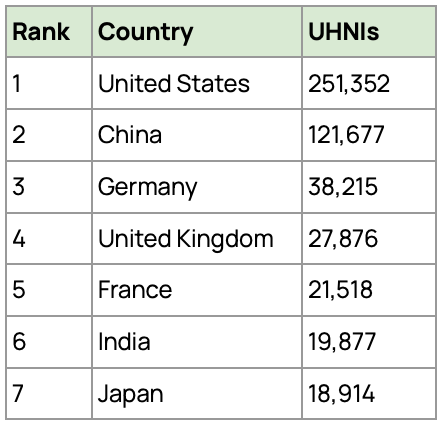
India’s billionaire population is also estimated to have increased from around 131 in 2021 to 207 in 2026, reflecting a CAGR of approximately 9.6%. It is projected to reach 313 by 2031, implying a further CAGR of around 8.6%. India already has the world’s third-largest billionaire population, behind only the US and China.
Wealth management has a much larger runway ahead. And that opportunity comes from India’s rapidly growing millionaire population.
In 2021, India had around 4.58 lakh households with a net worth of at least $1 million (roughly ₹9.5 crore). By 2025, that number had climbed to 8.71 lakh households.
That’s an addition of 4.13 lakh millionaire households in just four years; nearly 90% growth, or a 17.4% CAGR.
Even today, millionaire households make up a tiny fraction of India. They accounted for 0.17% of all households in 2021, rising to 0.31% by 2025. The numbers are still small, but the trend is hard to ignore.
Every new millionaire household brings a new set of financial decisions. Investments, taxes, retirement, estate planning and succession all become increasingly important as wealth grows. That is steadily expanding the market for wealth management, with affluent professionals, entrepreneurs, and investors joining the client base alongside traditional business families.
The formalisation of affluent wealth:
As per Deloitte, India’s addressable affluent segment consists of the top 4-5% of households, representing around 1.2–1.6 crore households. This group includes UHNI, HNI and other affluent households.
The estimated financial wealth of these households is around ₹104.5 lakh crore in FY24. Of this, registered wealth-management providers addressed roughly ₹66.5 lakh crore, while nearly ₹38 lakh crore remained self-managed or informally managed.
The financial wealth of these households is expected to reach around ₹218.5 lakh crore by FY29. This creates a large opportunity for organised wealth managers through both the growth of affluent wealth and the gradual movement of independently managed assets towards professional platforms.
Premiumisation:
As investors accumulate more wealth, their requirements become more complex. They gradually move beyond deposits and traditional mutual funds towards products such as PMS, AIFs, private credit, structured products, bonds and unlisted investments.
These products require greater expertise, more personalised advice and deeper due diligence. They also generally generate higher fees for wealth management companies.
India’s PMS AUM increased from ₹33.20 lakh crore in March 2024 to ₹41.42 lakh crore in March 2026, an increase of nearly 25% in two years. The number of PMS client accounts grew even faster, rising from around 1.62 lakh to 2.15 lakh, an increase of approximately 33%.
The non-EPFO and provident fund-managed pool, which is a better proxy for HNI, UHNI, corporate and institutional PMS assets, increased from ₹6.48 lakh crore to ₹7.99 lakh crore. This represents growth of around 23% over two years.
Over the same period, India’s mutual fund AUM increased from around ₹53.40 lakh crore to ₹73.73 lakh crore, a much stronger growth of 38%.
The growth in non-EPFO PMS assets and client accounts shows that more wealthy investors are shifting towards professional portfolio management. Mutual funds remain the larger and faster-growing route because of lower entry limits, SIP-led participation and wider distribution, while PMS continues to serve a smaller and more affluent customer base seeking customised portfolios.
AIF commitments also increased from ₹13.05 lakh crore in December 2024 to ₹15.74 lakh crore in December 2025, reflecting growth of around 21% in just one year.
A look at the US puts India’s opportunity into perspective.
The US is the world’s largest and most developed wealth management market. According to Cerulli’s 2026 research, US households held financial assets worth more than ₹9,690 lakh crore at the end of 2025, up 12% from the previous year.
What’s even more striking is the size of just one customer segment. Households with financial assets between ₹95 lakh and ₹19 crore, the middle-market and mass-affluent segment, controlled around ₹2,375 lakh crore across 4.69 crore households. That’s more than 10 times India’s entire projected affluent wealth opportunity for FY29.
For companies such as 360 ONE, the more relevant comparison is the high-net-worth segment.
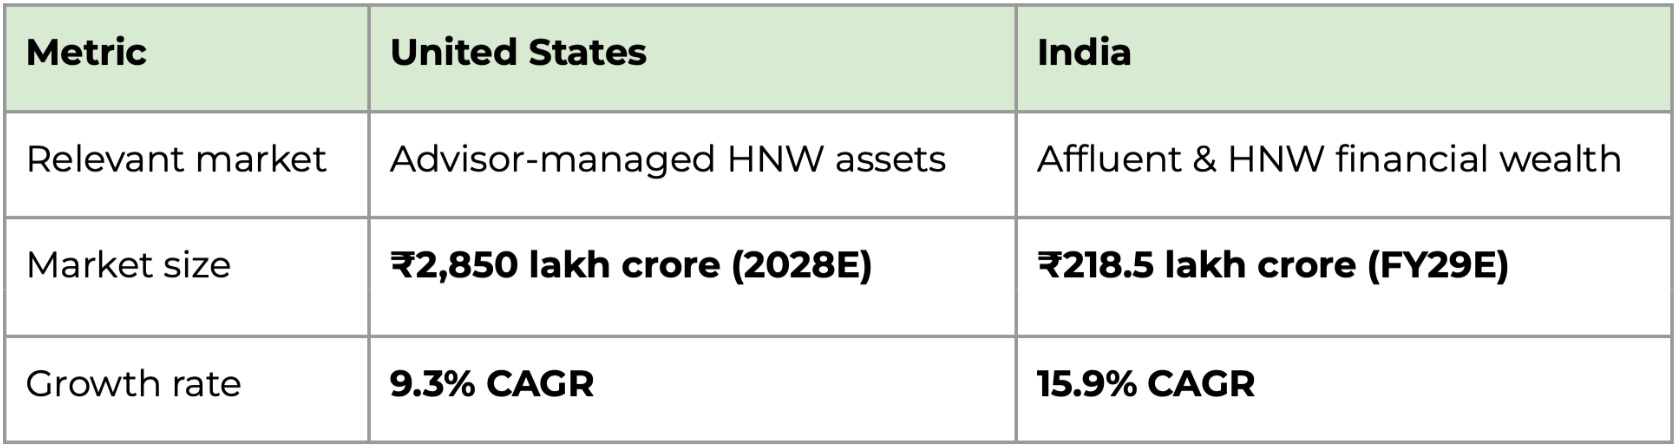
India is therefore growing significantly faster. However, even by FY29, its addressable affluent wealth pool would be equivalent to only around 7.7% of the US advisor-managed HNW market expected by 2028.
The comparison shows that India’s wealth management industry is growing rapidly, but remains far smaller and less penetrated than developed markets.
The US already has a deep ecosystem of private banks, independent advisers, broker-dealers, family offices and wealth platforms managing trillions of dollars.
India is only beginning to formalise its affluent wealth. As the number of wealthy families rises and more assets move towards professionally managed portfolios, organised wealth managers such as 360 ONE have a long growth runway ahead.
Now, let’s understand 360 ONE…
Think of it as a financial-services platform for wealthy families, business owners and institutional clients. It advises clients, distributes investment products, manages funds, provides loans, executes transactions and helps businesses raise capital.
The company began in 2008 as IIFL Wealth Management, focusing on ultra-high-net-worth families. As its client base grew, so did its offerings. What started with investment advice and product distribution gradually expanded into asset management, lending, estate planning, broking and capital-market services.
A few milestones shaped that journey:
2016: Acquired an NBFC
2019: Listed on the stock exchanges
2020: Acquired L&T Capital Markets
2022: Rebranded as 360 ONE
2024-26: Acquired ET Money to enter the mass-affluent segment, acquired B&K Securities to strengthen its broking and investment banking business, and entered a strategic collaboration with UBS to build global wealth management capabilities.
By March 2026, 360 ONE was serving more than 8,500 families and corporates and managing ₹6.74 lakh crore of assets.
The headline AUM, however, tells only part of the story.
₹3.12 lakh crore (46.3%) generated recurring revenue.
The remaining assets largely comprised transactional, broking and custody assets.
For wealth managers, the mix of AUM matters just as much as its size. Assets under advisory, distribution, lending or fund-management arrangements generate recurring income, while transactional and custody assets may generate revenue only when clients trade or use specific services.
In FY26, Wealth Management contributed around 74.5% of revenue from operations, while Asset Management contributed 25.5%, with both segments discussed in detail below.
360 ONE operates through three main business segments.
Segment #1: Wealth Management

This is the core business and focuses on providing advice, investment execution and financial solutions to wealthy families, business owners and corporates.
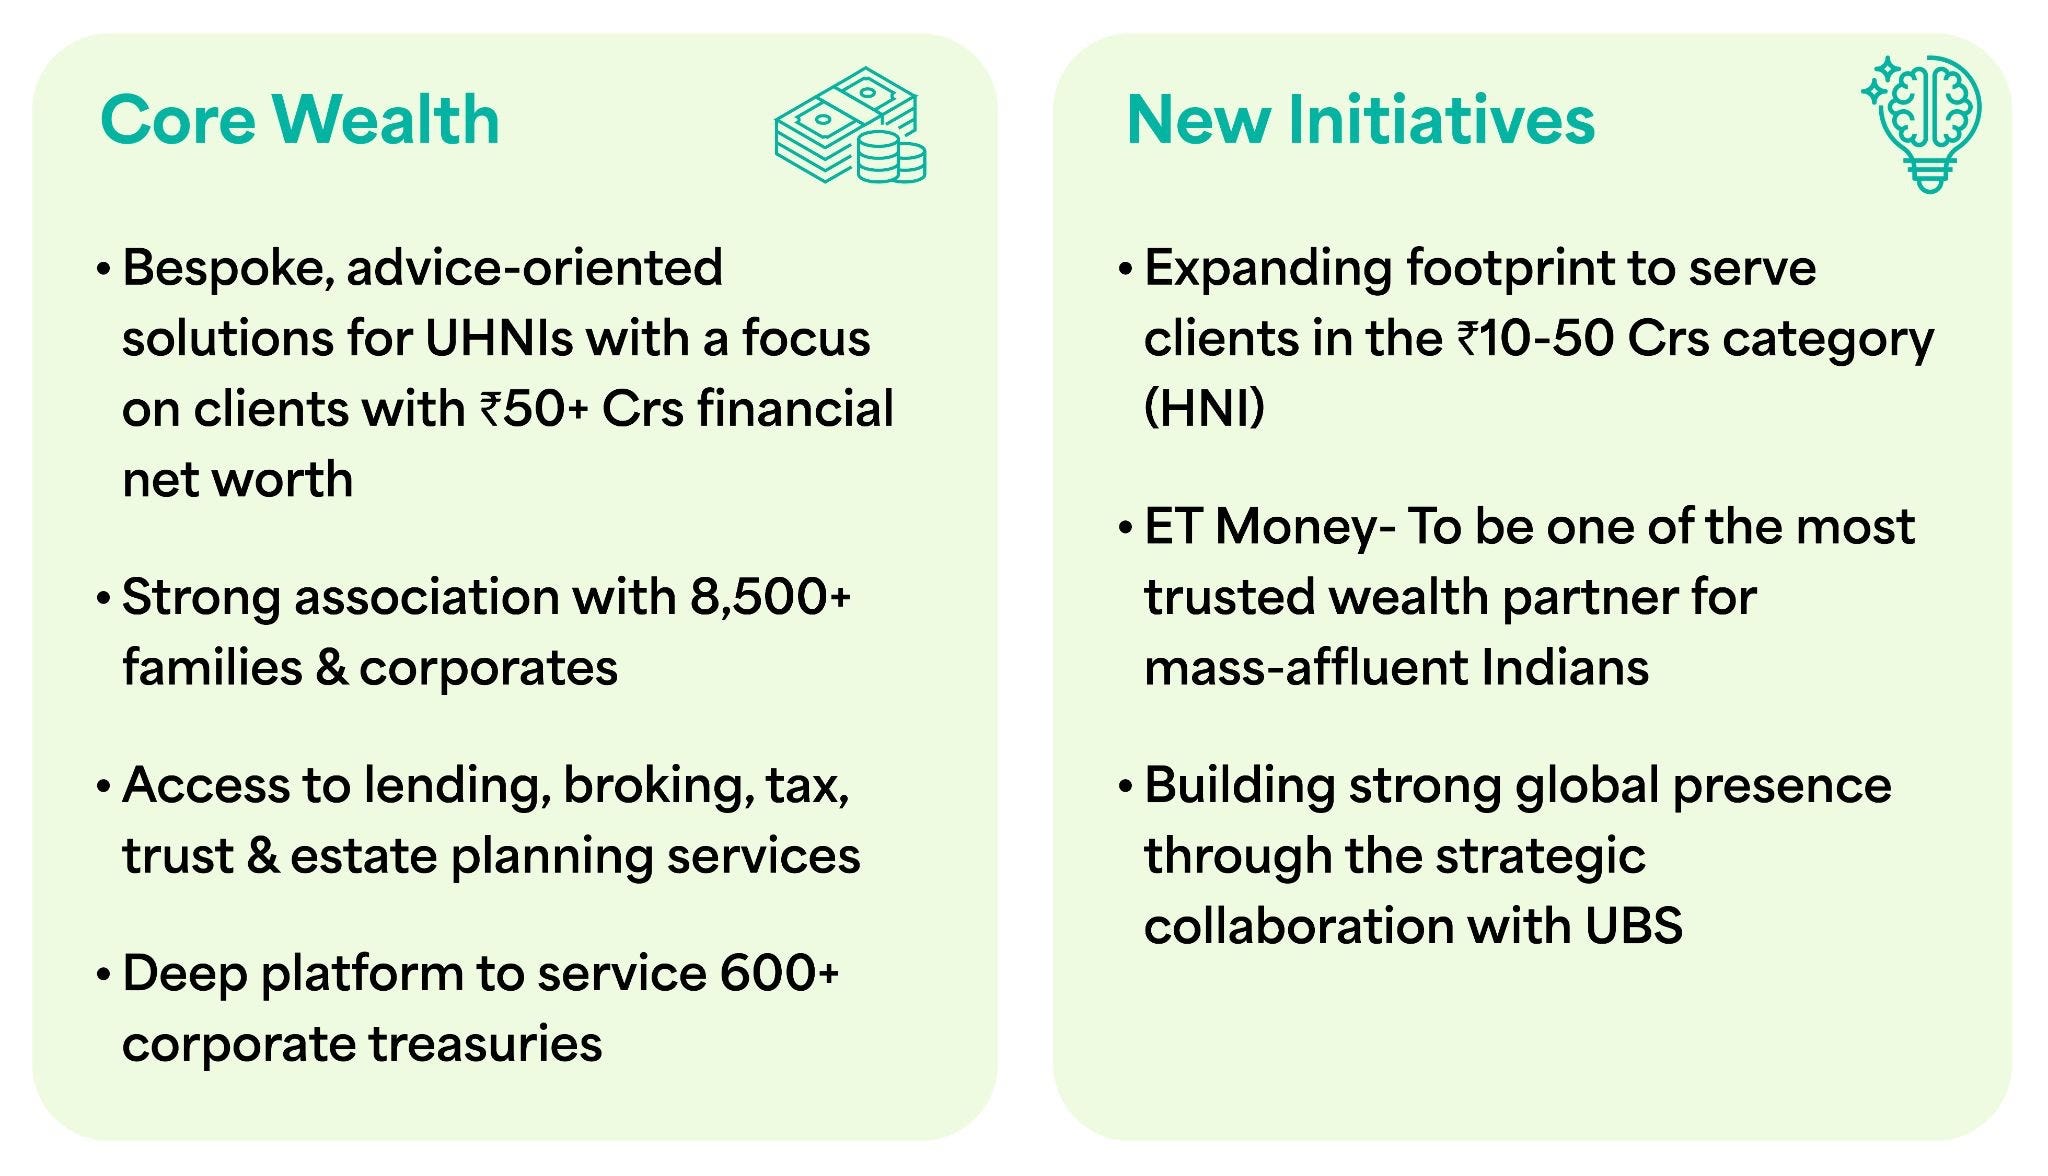
Its traditional Core Wealth business primarily serves ultra-high-net-worth clients with a net worth exceeding ₹50 crore. As of March 2026, the platform had relationships with more than 8,500 families and corporates and also served over 600 corporate treasuries.
Now, the company is expanding into the ₹10 crore to ₹50 crore HNI segment, entering the mass-affluent market through Reserve, ET Money and building global wealth capabilities through its partnership with UBS.
The business is built on long-term client relationships.
In FY26, clients associated with the company for more than five years formed 59% of relevant families but contributed 81% of AUM. Their average AUM per family was ₹68 crore, compared with ₹25 crore for clients associated for three to five years and ₹21 crore for newer clients. This suggests that clients gradually entrust a larger share of their wealth to 360 ONE as the relationship deepens.
Client attrition was 1.9% in FY26, while AUM loss was 0.8%.
Client attrition refers to the share of clients with more than ₹5 crore of AUM who left during the year, while AUM loss measures how much money moved out because of these departures.
So, since the company’s AUM loss was lower than client attrition, most of the clients who left were relatively small, while larger relationships remained stable.
However, 360 ONE was weaker than Anand Rathi Wealth on client retention. Its FY26 AUM loss was 0.8%, compared with 0.54% for Anand Rathi.
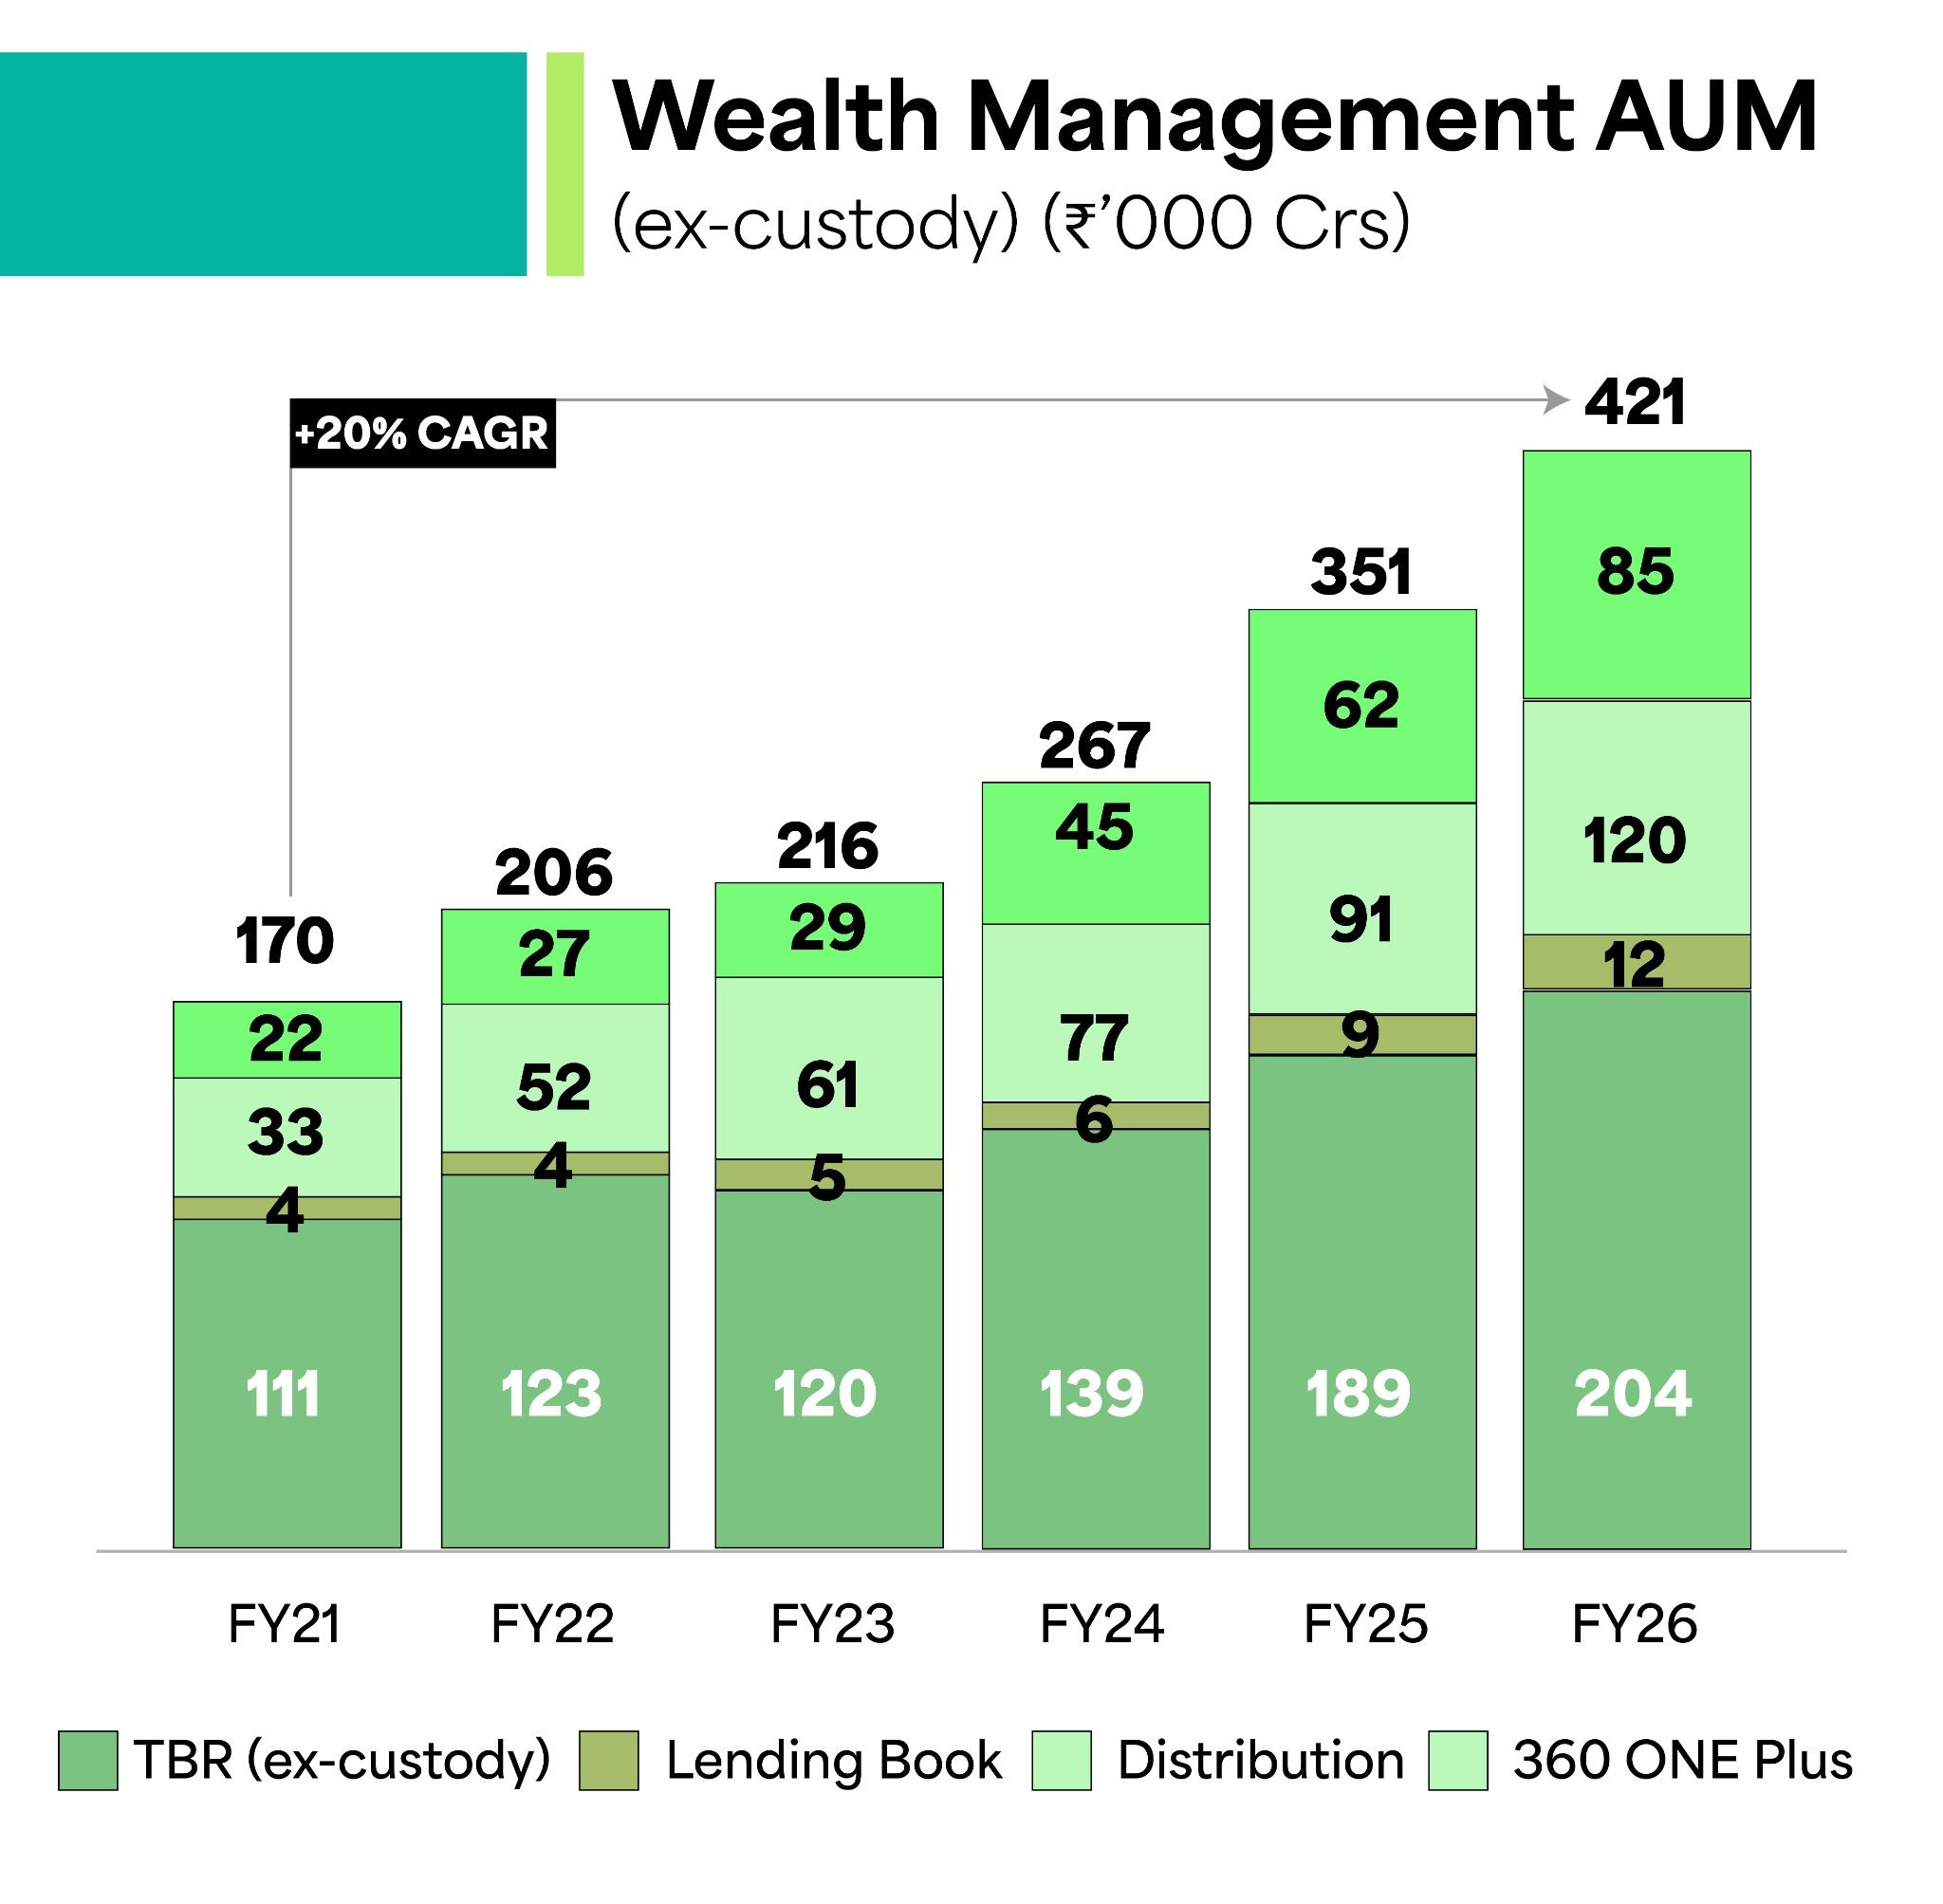
Total Wealth AUM, excluding custody assets, increased from ₹1.70 lakh crore in FY21 to ₹4.21 lakh crore in FY26, a CAGR of 20%.
More importantly, Wealth ARR AUM, which represents assets generating regular income, grew from ₹58,280 crore to ₹2.17 lakh crore at a much faster CAGR of 30%.
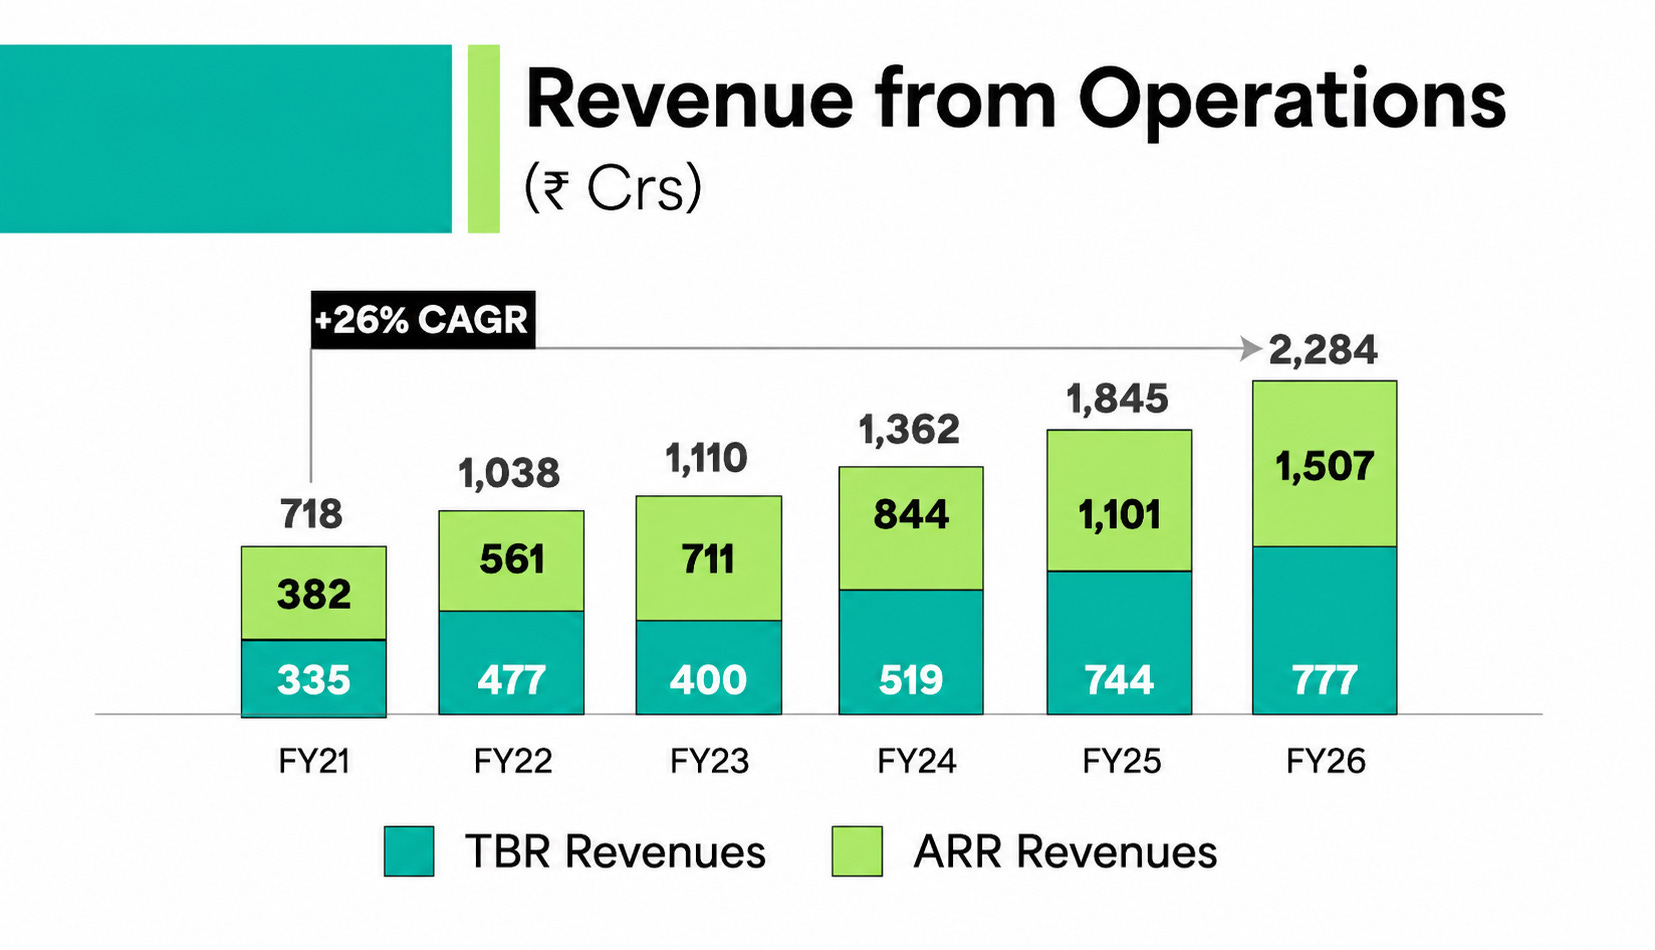
In FY26, the Wealth Management segment generated ₹2,284 crore in revenue from operations, equal to around 74.5% of consolidated operating revenue.
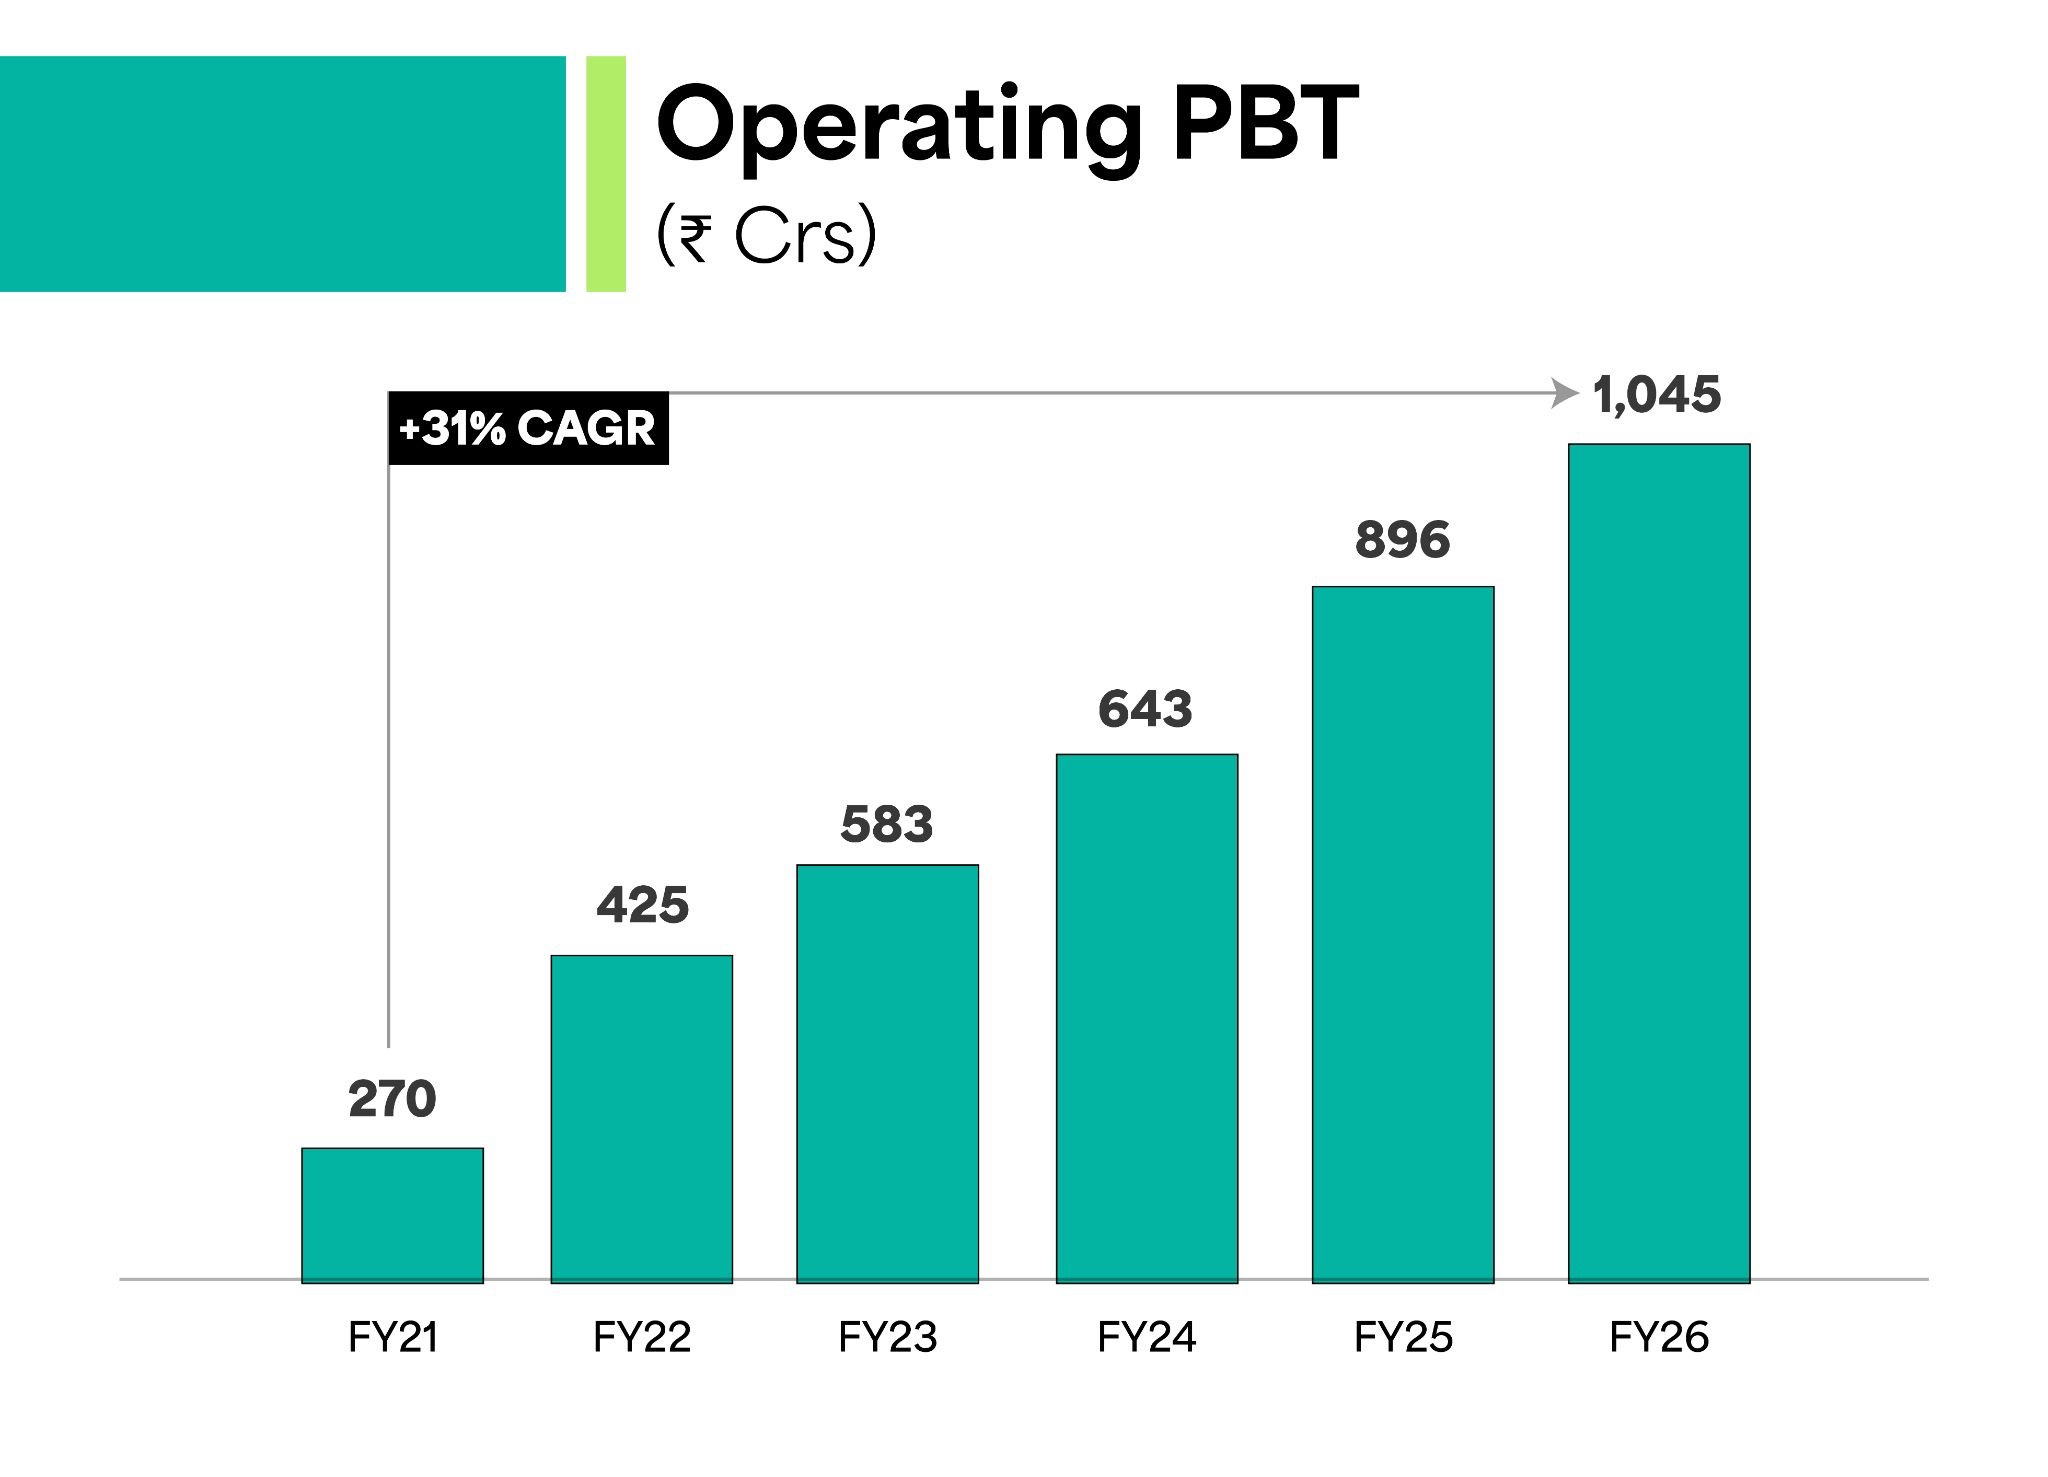
It also contributed ₹1,045 crore of operating profit before tax, or nearly 70% of consolidated operating profit.
Take a look at the different businesses under this segment:
360 ONE Plus: 360 ONE Plus is the company’s advisory and portfolio management business. In an advisory, the company suggests where clients should invest, but the final decision remains with the client. In discretionary management, 360 ONE manages the portfolio on the client’s behalf within agreed rules.
Its AUM grew from ₹21,622 crore in FY21 to ₹85,039 crore in FY26, a CAGR of around 32%. In FY26, it earned ₹221 crore of recurring revenue, contributing about 9.7% of Wealth Management revenue. This works out to a revenue yield of around 0.30% on average AUM of ₹72,385 crore.Product Distribution: This business distributes mutual funds, PMS, AIFs, bonds and other investment products, earning commissions from product manufacturers. Its AUM increased from ₹33,038 crore in FY21 to around ₹1.20 lakh crore in FY26, a five-year CAGR of 29%. The business generated ₹753 crore of revenue in FY26, contributing around 33% of total Wealth Management revenue, at an average revenue yield of nearly 0.65%. The income is recurring and asset-light, but depends on product mix and commission rates.
Lending: Wealthy clients may need cash without wanting to sell their long-term investments, so 360 ONE provides loans against shares, mutual funds and other financial assets. Its lending book grew from ₹3,620 crore in FY21 to ₹12,028 crore in FY26, a CAGR of around 27%. In FY26, an average lending book of ₹9,632 crore generated ₹534 crore of revenue, contributing about 23.4% of Wealth Management revenue. Lending earns more revenue per rupee of assets than advisory or distribution, but it also requires capital and borrowed funds, which exposes the business to funding costs, collateral-value movements and credit risk. According to management, the business has not reported any NPA or lending loss since it began operations in 2016.
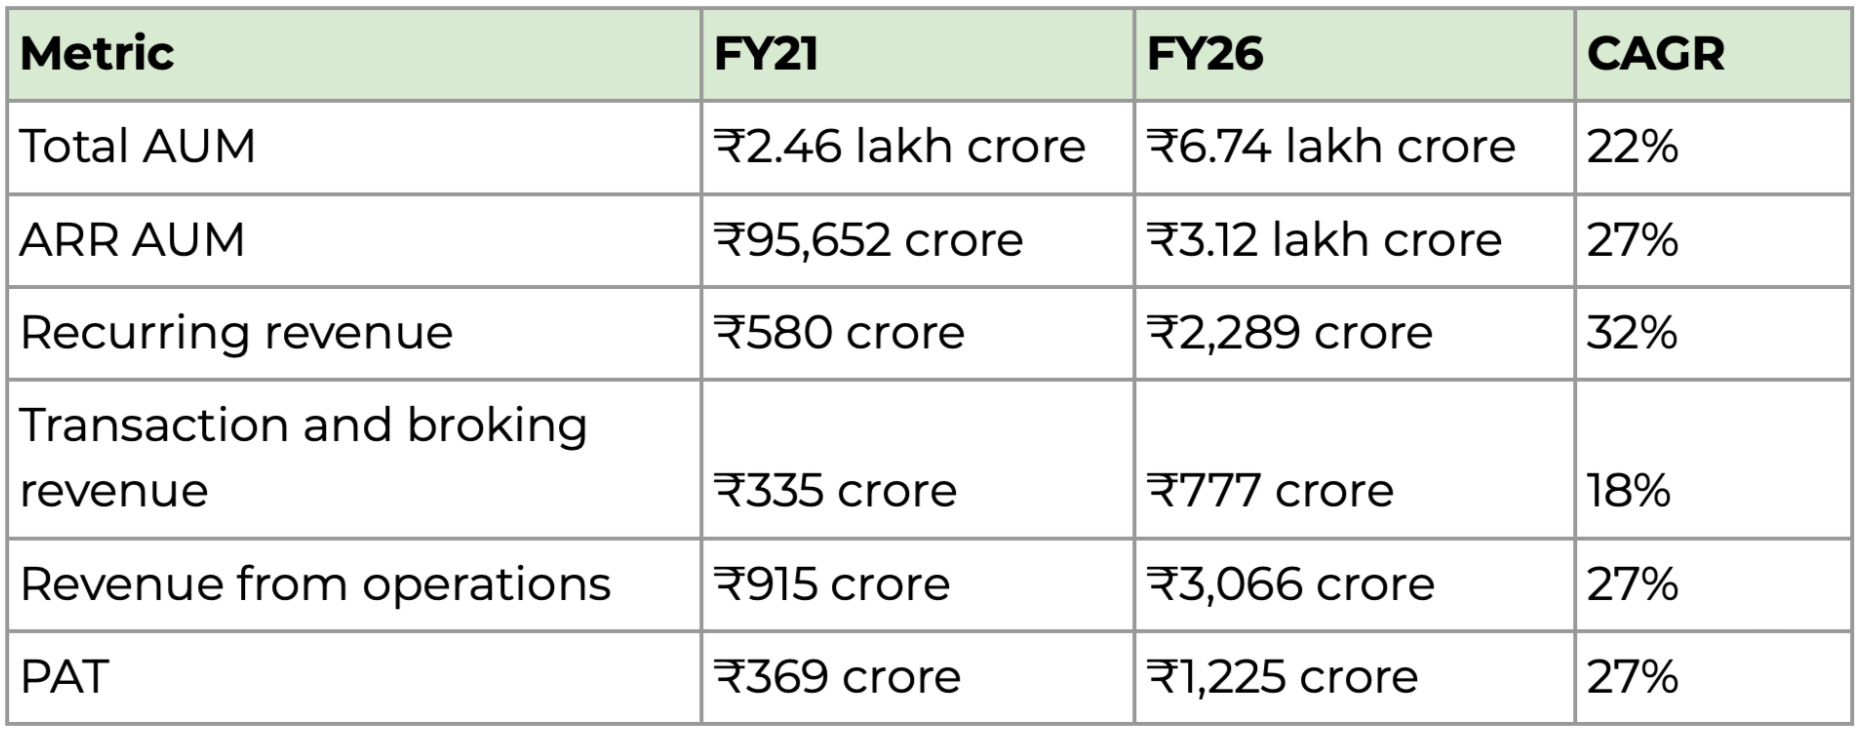
Transaction and Broking: This business of the segment earns fees when clients transact in equities, bonds, unlisted securities and other investment products. Transaction and broking AUM, excluding custody assets, increased from ₹1.11 lakh crore in FY21 to ₹2.04 lakh crore in FY26, a five-year CAGR of 13%. Revenue increased from ₹335 crore to ₹777 crore over the same period, a CAGR of 18%, and contributed around 34% of total Wealth Management revenue in FY26. However, part of this growth came from the acquisition of B&K Securities, now 360 ONE Capital. Unlike recurring fees, transaction income also depends more heavily on client activity, completed deals and market conditions.
Segment #2: Asset Management
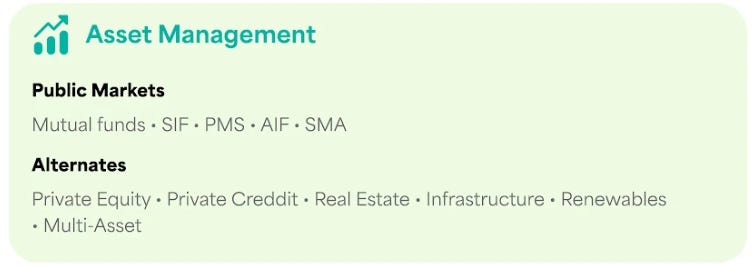
360 ONE manages money through mutual funds, PMS and AIFs across public equity, private equity, private credit, real estate and infrastructure. Unlike traditional AMCs, which are mainly focused on retail mutual funds, 360 ONE is heavily tilted towards alternatives and managed accounts.
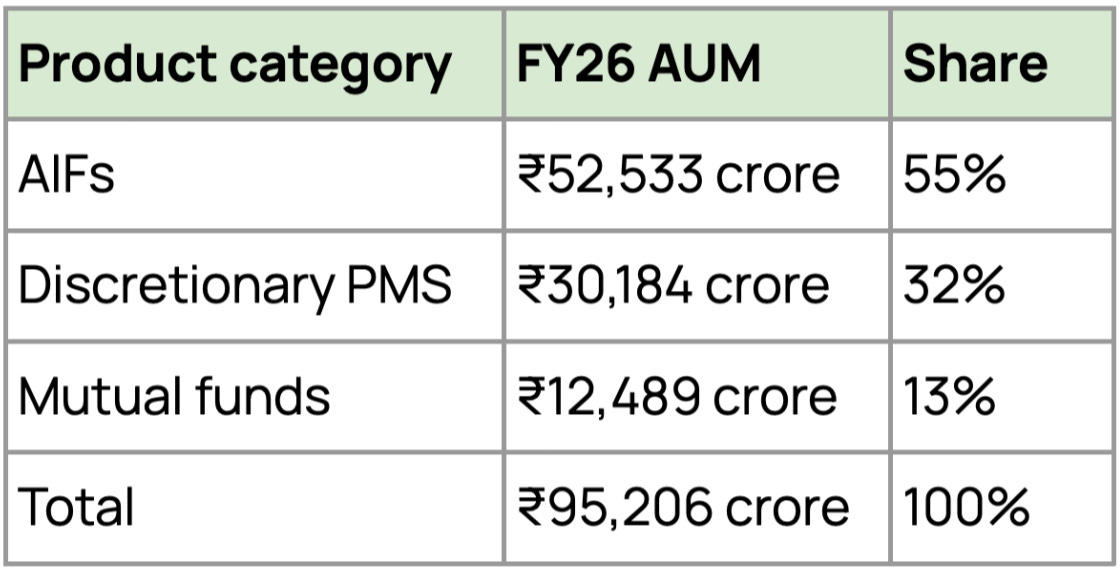
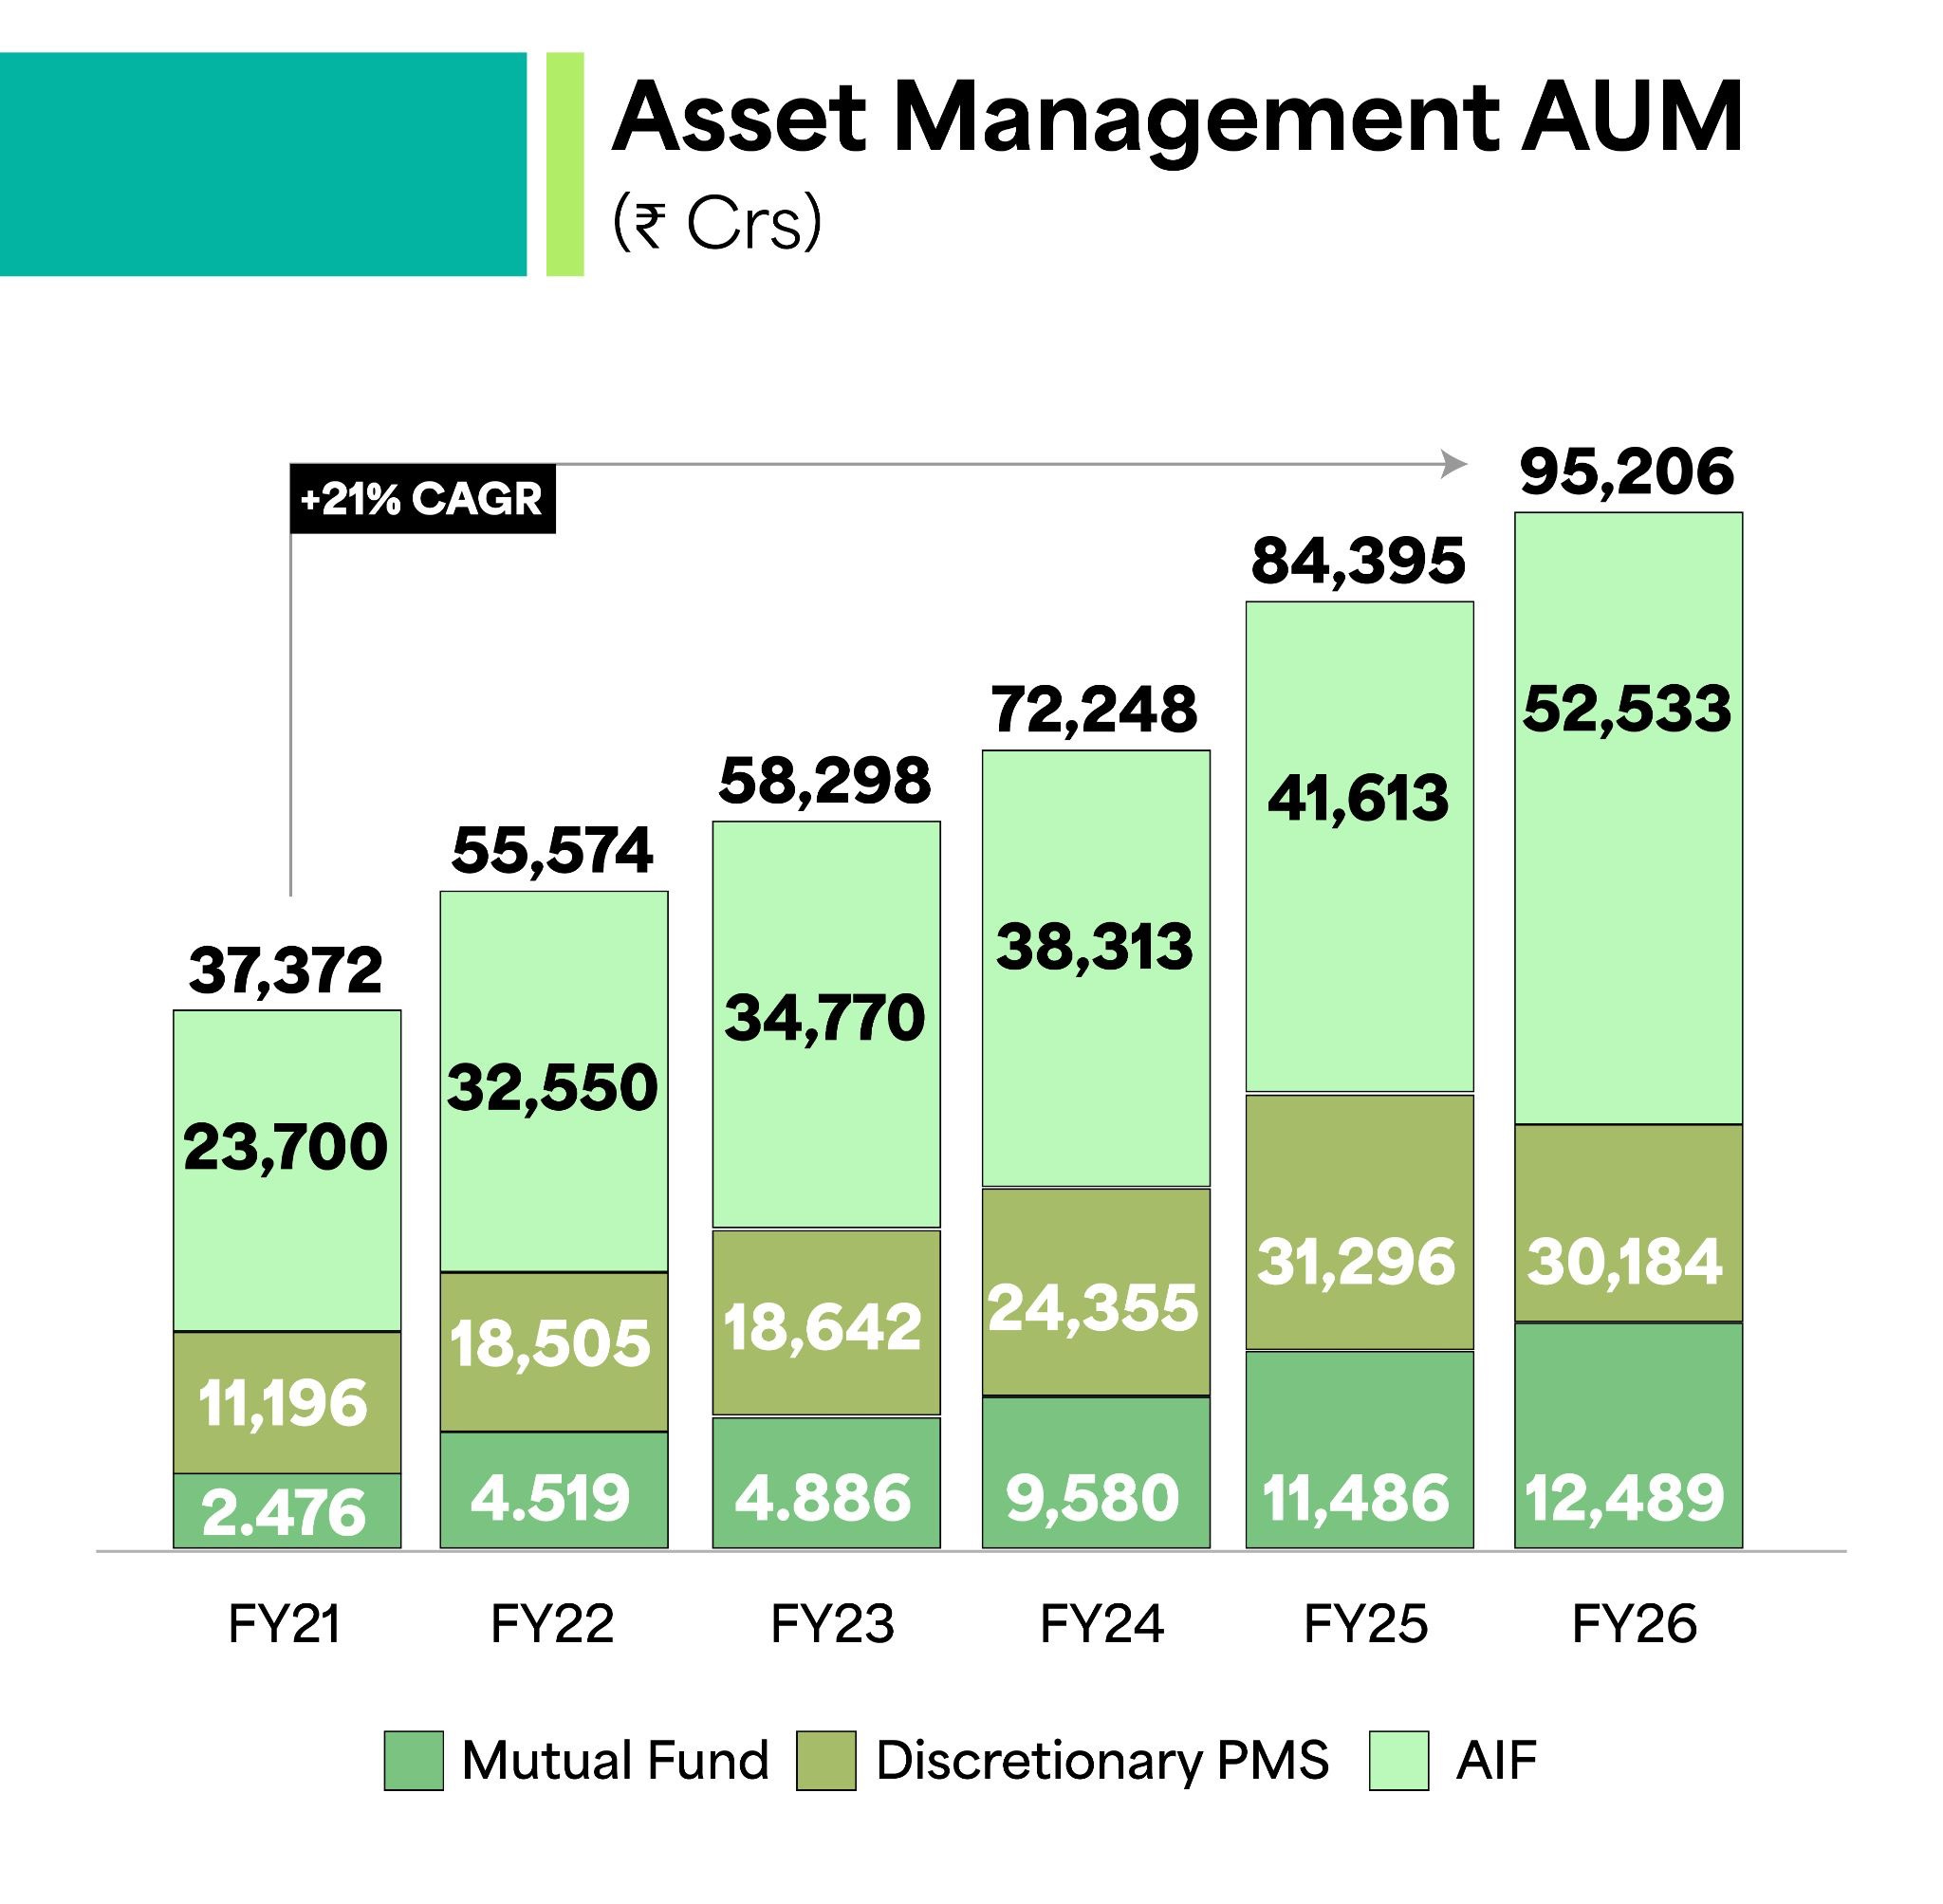
Asset Management AUM increased from ₹37,372 crore in FY21 to ₹95,206 crore in FY26, a CAGR of 21%.
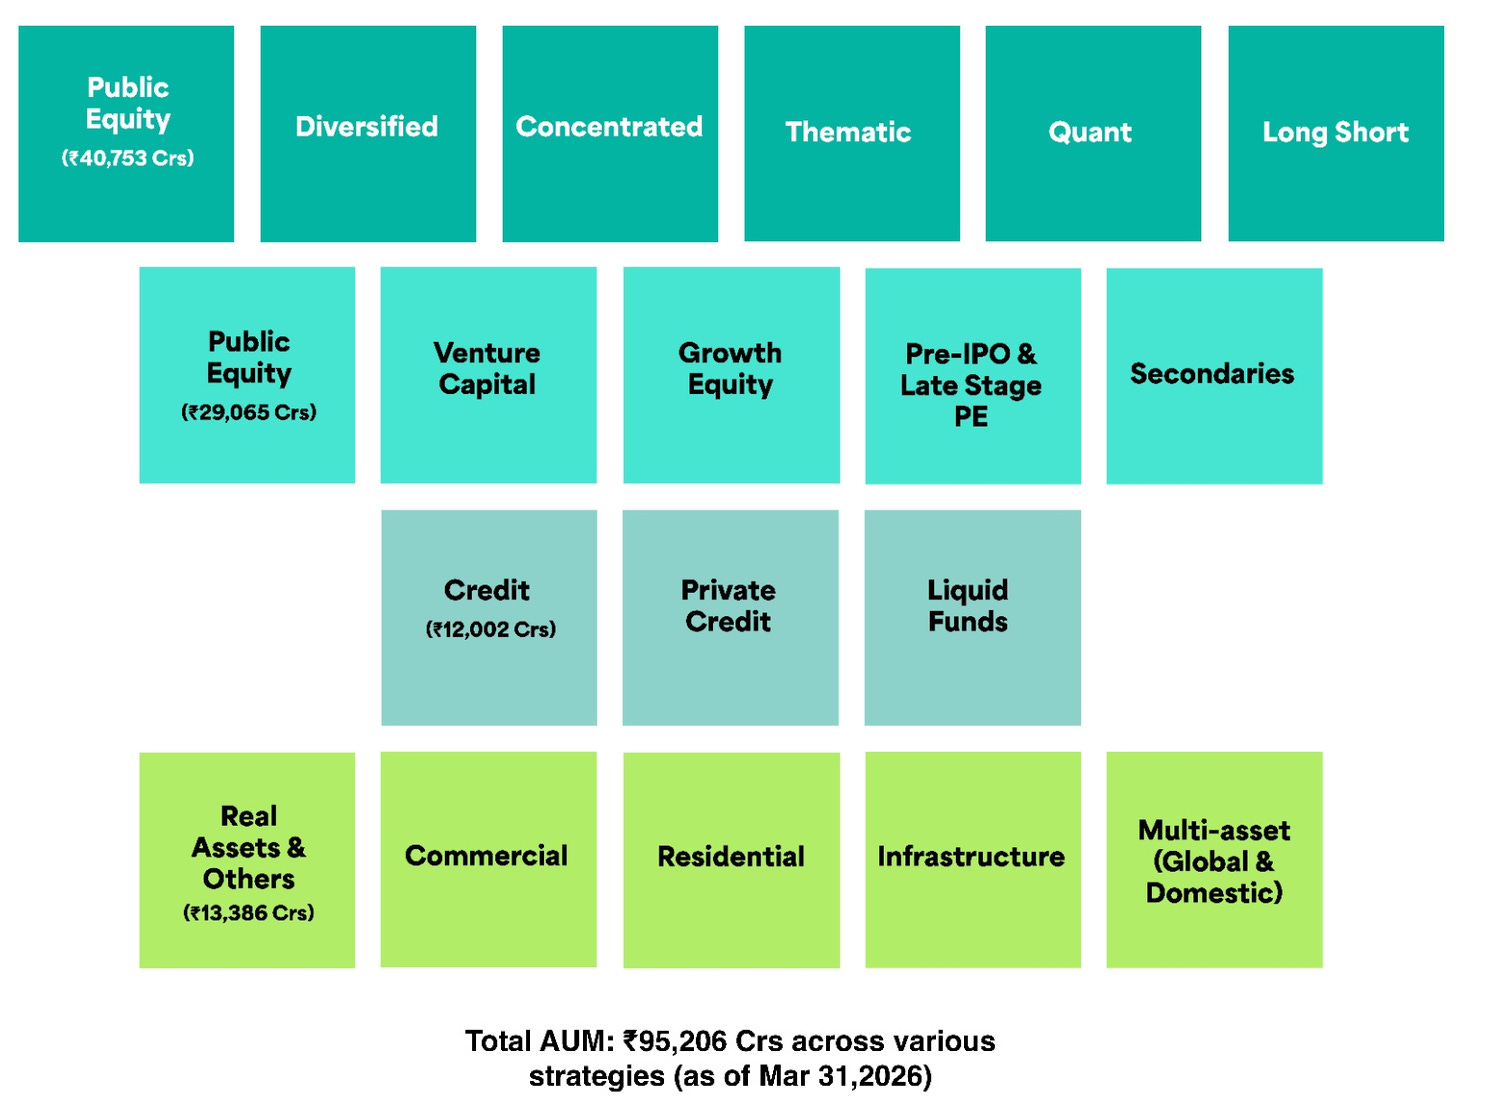
By investment type, public equity formed around 43% of AUM, while private equity, credit and real assets together contributed around 57%.
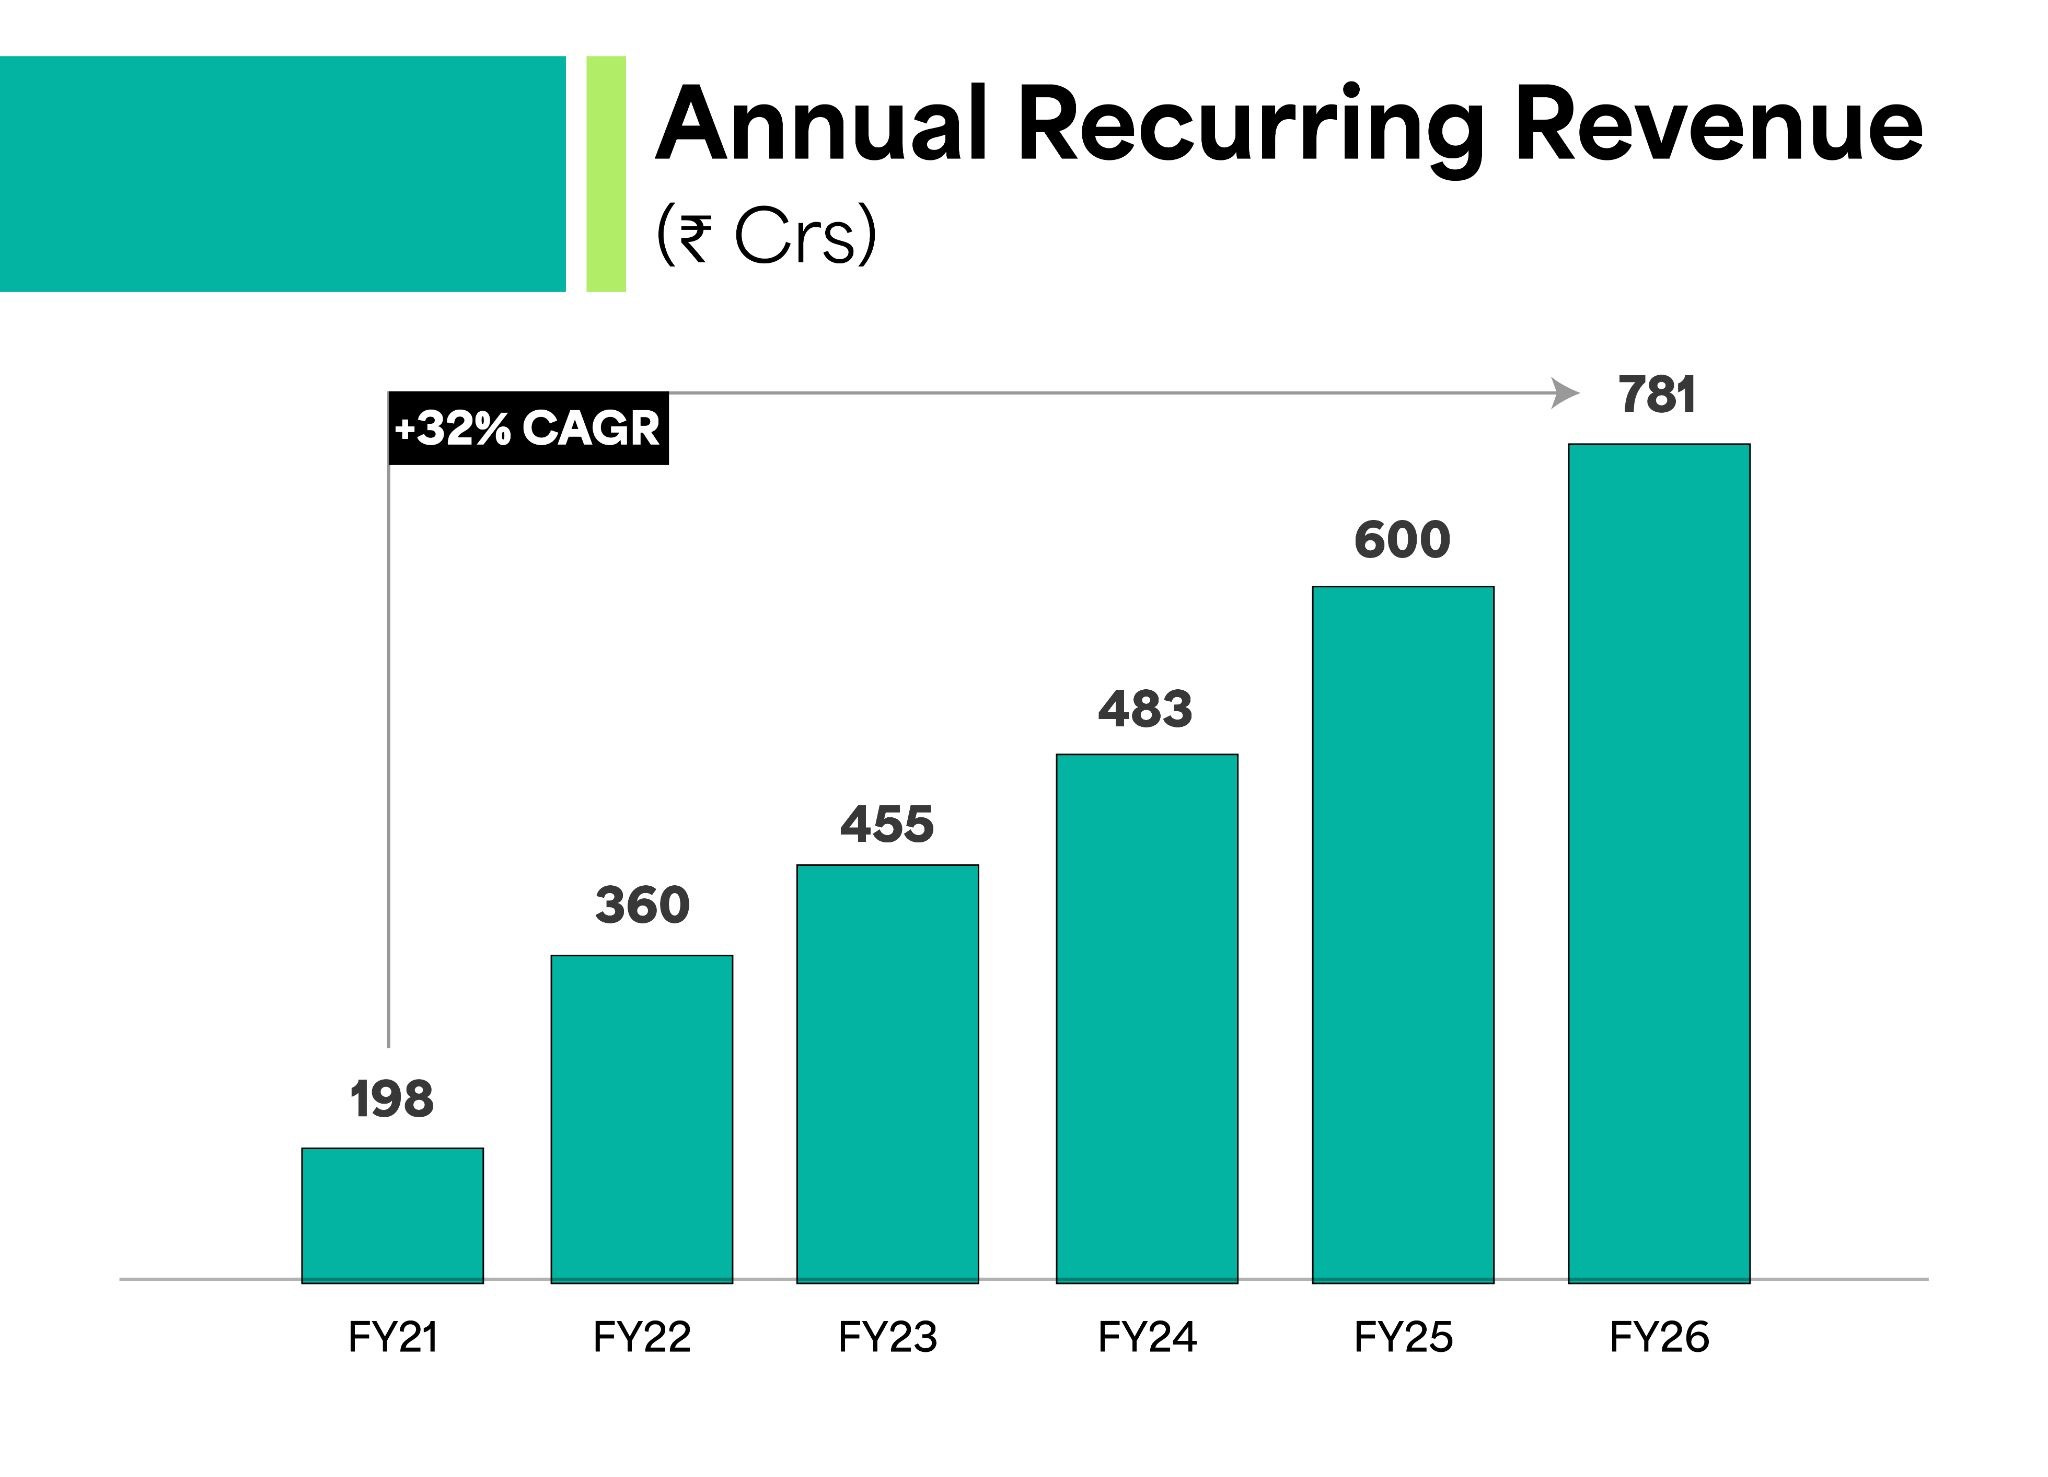
In FY26, the segment generated ₹781 crore of recurring revenue on average AUM of ₹93,862 crore, implying a revenue yield of 0.83%. This accounted for around 25.5% of consolidated revenue from operations.
Alternatives are the biggest earnings driver for this business. In FY26, listed strategies generated ₹258 crore of revenue, while alternatives contributed ₹524 crore (around 67% of the segment’s total revenue). The gap is even more visible at the operating-profit level, where alternatives generated ₹331 crore, compared with ₹123 crore from listed strategies.
To understand why, let’s look at the fee structure. 360 ONE’s mutual fund business earns an average retention yield of around 0.46%, while discretionary portfolios earn 0.80%. Private equity strategies, on the other hand, earn around 1.50%. That’s because sourcing private deals, conducting due diligence and actively managing these investments requires significantly more specialised work.
There’s another source of earnings that makes alternatives even more attractive. They generate performance-linked carry income, which contributed ₹162 crore in FY26 (~21% of the segment revenue).
Think of it as the fund manager’s share of the investment profits once returns cross a pre-agreed hurdle.
On top of that, investors’ capital in alternative funds is generally committed for several years. This provides better revenue visibility than mutual funds, where investors can redeem their money more freely.
Segment #3: Capital Markets
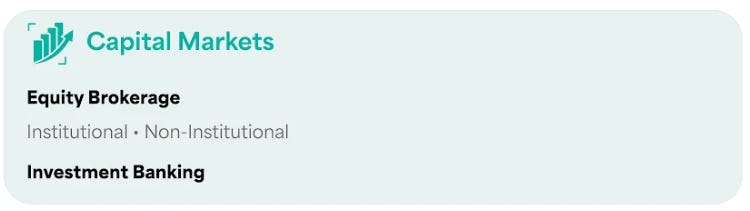
This combines broking, research and investment-banking services. Its institutional broking business serves more than 300 domestic and foreign institutions and provides research coverage on over 500 companies, with a strong focus on mid- and small-cap stocks.
The segment also helps companies raise equity through IPOs, QIPs, block deals and preferential issues. Its non-institutional broking business serves family offices and UHNIs, allowing the company to use its research and execution capabilities across its Wealth and Asset Management businesses.
There’s one limitation here. The company does not yet disclose the complete revenue and profit of Capital Markets separately. Institutional broking income is currently included within transaction and broking revenue under the broader Wealth Management segment.
On a consolidated basis…
Total AUM increased from ₹2.46 lakh crore in FY21 to ₹6.74 lakh crore in FY26, a CAGR of 22%.
ARR AUM grew faster, from ₹95,652 crore to ₹3.12 lakh crore, at a CAGR of 27%.
In FY26, total ARR net flows stood at ₹55,875 crore, of which ₹35,199 crore came organically. In other words, around 63% of the money came from existing businesses attracting fresh client capital, rather than from acquired businesses.
The client mix has also improved over time.
The total number of relevant Wealth Management clients increased from 6,707 in FY21 to 8,576 in FY26, a CAGR of around 5%. The greater detail, however, is at the higher end of the client base:
Clients with more than ₹10 crore of AUM increased from 1,825 to 3,777 (around 16% CAGR).
Average Wealth AUM per client almost doubled from ₹25 crore to ₹49 crore.
That suggests the company isn’t just adding clients but also attracting larger relationships.
FY26 did see a couple of metrics move in the opposite direction. The cost-to-income ratio, which measures how much the company spends to earn every ₹100 of income, improved steadily from 53.9% in FY21 to 45.9% in FY25, then moved back to around 50% in FY26. The increase largely reflects investments in ET Money, Reserve, technology, new relationship managers and the consolidation of 360 ONE Capital.
Return on Equity also fell from 20.7% in FY25 to 13.6% in FY26.
Now, mark the timing. During FY25, 360 ONE raised capital through a QIP and also received the initial 25% warrant payment under its strategic collaboration with UBS. That immediately increased the equity base, while earnings from deploying this capital will take time to materialise.
Also, the acquisitions of B&K Securities and UBS’s India wealth business added client relationships, platforms and future earnings potential to the balance sheet, resulting in higher goodwill and intangibles.
Management has already outlined where that capital is being deployed:
55-60% towards the lending business
35-40% towards the Alternatives business as sponsor capital.
That makes the recent decline in RoE look more like a temporary effect of deploying fresh capital than a sign of weakness in the underlying business.
Natural thought: Where will the company’s next phase of growth come from?
Well, there are 4 areas that 360 ONE is working on.
Moving beyond its traditional UHNI base. Through Reserve, 360 ONE is expanding below its traditional ₹50 crore-plus UHNI market. The company’s investor presentation defines the HNI segment as ₹10 crore to ₹50 crore, while management has described Reserve’s target market as ₹5 crore to ₹50 crore during earnings calls. More recently, it also said the platform can serve clients with ₹2 crore to ₹25 crore. The exact target market remains unclear.
ET Money is a separate digital platform aimed at mass-affluent investors. It offers investment products and subscription-based advice, with assisted human advisory services targeted at clients holding portfolios above ₹25 lakh.Targeting global wealth. Through its partnership with UBS, 360 ONE has added more than 80 UHNI families and over ₹5,000 crore of relevant assets. The partnership also allows Indian clients to access global investment products while giving UBS clients access to 360 ONE’s domestic alternative funds.
The acquisition of B&K Securities, now 360 ONE Capital. The acquisition of B&K Securities, now 360 ONE Capital, has made the company’s research and broking business stronger. Its team covers more than 500 companies, which can help 360 ONE offer better equity ideas to existing UHNI clients and also support the investment banking business it is building. UHNI equity broking currently earns around ₹85 crore to ₹90 crore a year, and management believes this can double or even triple over the next three to five years. The company is also growing beyond the main metros and looking to serve more NRI clients in Dubai and Singapore through its partnership with UBS.
Running a hybrid business. 360 ONE earns steady fees by advising clients and distributing investment products, but unlike a pure advisory firm, it also uses its own capital to lend to clients and invest in alternative funds. This allows the company to earn from advice, product manufacturing, lending and transactions, ultimately creating a flywheel for 360 ONE. The same client can use the company for advice, investment products, lending and transactions, allowing each business to feed the others and increase revenue from the relationship over time.
360 ONE in comparison.
The closest three listed wealth managers follow very different business models.
Anand Rathi Wealth has kept its model simple and asset-light. A large part of its business caters to HNIs with ₹5 crore to ₹50 crore of wealth, who account for around 50% of its ₹93,037 crore AUM. The company largely distributes mutual funds and structured products, earning recurring trail commissions along the way. Without a large lending book or meaningful investments in manufacturing alternative funds, it also delivers the highest RoE among the three at 46.7%.
Nuvama has built the broadest platform. Alongside wealthy families, it serves more than 13 lakh retail and affluent clients through a combination of technology and relationship managers across 500+ locations. Its digital platform offers equities, mutual funds, bonds and other investment products, while its Asset Services business provides custody and clearing services for over $13.8 billion of assets. Together, these businesses create another stream of recurring income and help the company maintain a healthy 28.1% RoE.
360 ONE, on the other hand, has gone deeper rather than wider. Its focus remains on ultra-rich families with more than ₹50 crore of wealth. Unlike Anand Rathi, it not only advises clients but also manufactures alternative products and manages a ₹ 12,028-crore lending book. These businesses generate higher fees but require significant capital, which has reduced its reported RoE to 13.6%. However, it still generated the highest absolute profit among the three at ₹1,225 crore in FY26.
Verdict:
For the growing ₹5 crore to ₹50 crore affluent segment, Anand Rathi currently looks better placed because its model is built for this market, with standardised portfolios and low client and RM attrition. Nuvama also benefits from its wide branch, RM and digital network.
360 ONE is still building this business. Reserve manages around ₹4,000 crore, while Reserve and ET Money are yet to reach scale and are still adding to costs. Competitors that win these clients early may retain them as their wealth grows, making it harder and more expensive for 360 ONE to acquire them later. However, 360 ONE remains stronger in complex UHNI needs, alternative investments and lending.
Has management walked the talk?
Management aimed for organic net flows equal to 12-15% of opening ARR AUM, 16-18% revenue growth and 15-25% profit growth.
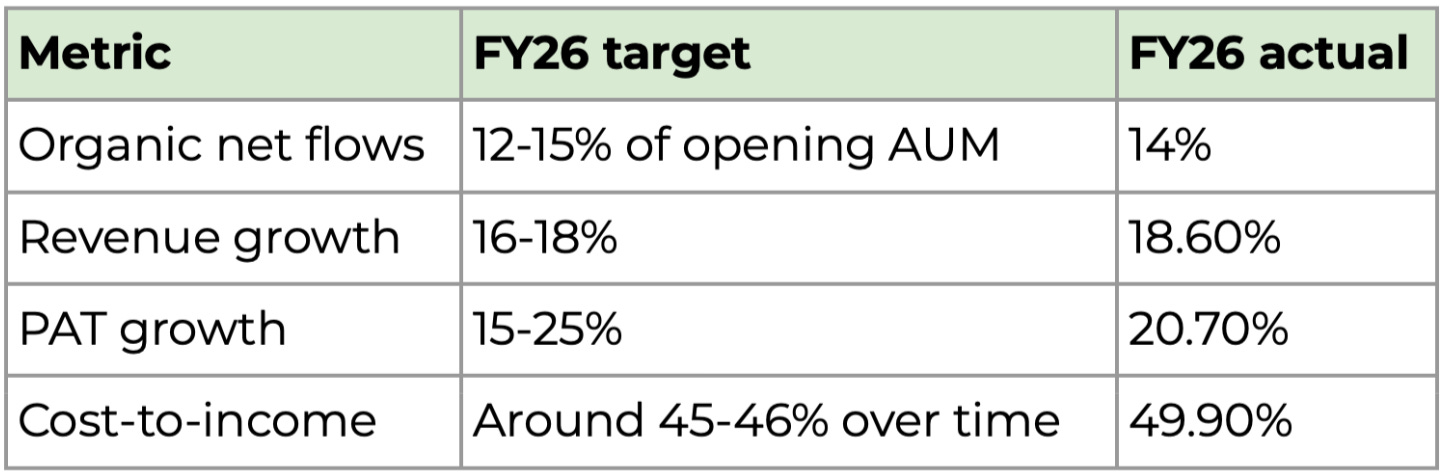
One metric worth keeping an eye on is the cost-to-income ratio. It ended FY26 at around 50%, above management’s preferred 45-46% range. Put simply, the company spent nearly ₹50 to earn every ₹100 of income.
The elevated ratio mainly reflected investments in Reserve, ET Money, technology and newly hired relationship managers, along with the consolidation of 360 ONE Capital and ET Money. These businesses currently dilute consolidated margins, although the mature UHNI Wealth and Asset Management businesses continue to operate at a healthier cost-to-income ratio of around 44-45%. Management expects efficiency to improve as the newer businesses scale and move towards break-even.
So far, management has largely delivered on what it set out to achieve: strong organic flows, higher revenue and profit. The next milestone is operating leverage.
This creates a different set of risks for investors.
The biggest risk is dependence on relationship managers. Wealth management is built on personal trust, so when a senior RM leaves, some clients may move their money with them.
In FY26, the departure of a few senior teams led to estimated outflows of around ₹3,500-4,000 crore. Management believes the business must remain prepared for an annual attrition of 2-4%. The risk is that replacing these teams requires expensive hiring, while new RMs may take time to bring in enough assets.
Also, because 360 ONE charges fees as a percentage of Assets Under Management (AUM), its recurring revenues are deeply tied to capital market valuations. A severe market correction would instantly shrink AUM and compress fee income, while also drying up its transactional and brokerage revenues.
Management relies on a steady 10-12% mark-to-market portfolio benefit during normal years to achieve its growth targets. So, to protect against severe cyclicality, they actively diversify the business away from pure equities. Currently, a portion of their transaction revenues comes from fixed income, unlisted equity, private credit, and real estate trusts (REITs), making their revenue streams “all-seasons” rather than purely reliant on bull markets.
Wealth creation in India is attracting aggressive competition from large banks, boutique advisory firms, and institutional brokers that are pivoting to wealth management. When asked if the UHNI space will remain a comfortable two-player oligopoly, management stated that it is a “virtual impossibility”. They believe the market is expanding so rapidly that there is ample room for at least 3-4 potentially larger players to emerge.
Coming to 360 ONE’s valuation…
At 37x earnings, 360 ONE is trading slightly above its historical median valuation of 35x. But can the company grow fast enough to justify today’s valuation?
Assuming a five-year holding period and a 15% annual return expectation, the answer depends largely on the valuation multiple the market is willing to assign five years from now.
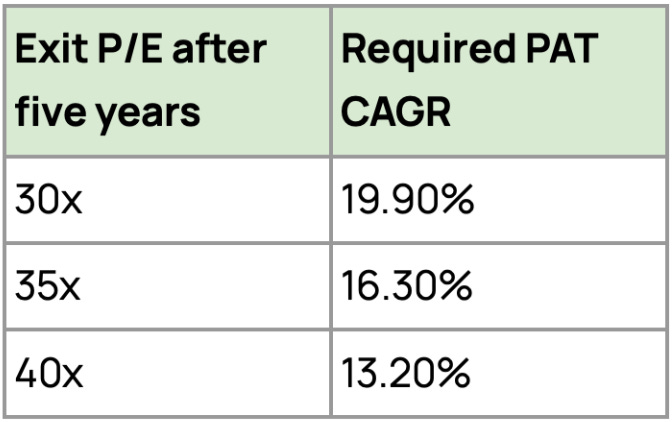
Let’s start with the base case, where the stock eventually trades at its historical median P/E of 35x. Under this assumption, 360 ONE needs to grow its PAT by around 16.3% a year for an investor to earn a 15% annual return, excluding dividends.
Is that achievable?
Management believes so. It has guided for 15-25% long-term profit growth. Getting there, however, will require the company to keep attracting organic inflows, improve its cost-to-income ratio, and turn businesses like Reserve, ET Money and 360 ONE Capital into meaningful contributors to profits.
The current valuation leaves little room for disappointment. If PAT compounds at 18-20%, investors could still earn attractive returns. But if profit growth slips below 16%, or the newer businesses take longer than expected to mature, returns could disappoint, even if the company itself continues to grow.
In our view…
360 ONE is among the few listed pure plays on India’s UHNI and alternatives opportunity. Its deep client relationships, 75% recurring revenue mix, and ability to earn across advisory, distribution, lending and product manufacturing provide multiple growth levers.
That said, it’s not an easy business to run. The model is more capital-intensive, talent-dependent and complex than a pure distributor platform.
Now, remember: our DeepScans answer how businesses work and why they deserve to be analysed. But if you’d like to know which companies deserve a place in a long-term portfolio, you’ll find them in Finology 30.
Finology’s Exclusive Updates
1. Finology 30 Stock Update
This week, we updated our Finology 30 portfolio with a diversified franchise of sorts.
We like this business because the market is mistaking a temporary slowdown for a permanent decline. We believe the franchise remains fundamentally strong, with multiple growth drivers intact and meaningful upside as conditions normalise.
The full research report, along with the company name and Buy It Below price, is available in the Finology 30 dashboard.
2. From Ticker: The Packaged Snacks & Namkeen Shift
Packaged namkeen and snacks are steadily replacing loose, unbranded alternatives. Quick-commerce has accelerated this trend, helping organised brands expand beyond their regional markets.
Use Ticker to identify the companies benefiting from this shift:
Check Inventory Turnover: Faster inventory movement often indicates strong demand and efficient operations.
Track OPM: Companies that maintain margins despite rising input costs usually have stronger pricing power.
Review Cash Flow: Look for businesses where operating cash flow closely matches net profit.
Read Investor Presentations: See which brands are growing through quick-commerce and expanding digital distribution.
As consumption shifts toward organised brands, Ticker can help you identify the companies gaining market share.
That’s a Wrap for Today!
We’re always looking for interesting businesses and industries to explore.
If you enjoyed this DeepScan, we’d love to hear from you. And if there’s a company, industry, or business model you’d like us to break down next, simply reply to this email or drop a comment.
See you in the next edition!
Pranjal Kamra
Research: Jayesh Mohta
Editorial: Mehvish Qureshi
Disclaimer
The information and analysis provided herein are for educational and informational purposes only and do not constitute investment advice, a research recommendation, or an offer, solicitation, or recommendation to buy, sell, or hold any security. Investors should exercise their own judgment, conduct independent due diligence, and consult professional advisers before making investment decisions. Finology Ventures Private Limited, its affiliates, directors, employees, and research analysts shall not be liable for any loss or damage arising from the use of or reliance on this information.
SEBI Registered Research Analyst Details:
Registered Name : Finology Ventures Private Limited (RA Division)
Registration No : INH000024277
BSE Enlistment No. : 6877
Validity : Dec 16, 2025 - Dec 15, 2030
Please analyse pharma sector